vscode: Visual Studio Debugger Crashes when hover over variable on breakpoint
I have very straight forward code which is:
index.js
let myvar = `some value`;
console.log(myvar)
myvar = 'new val';
console.log(myvar)
package.json
{
  "name": "vs_crash",
  "version": "1.0.0",
  "description": "",
  "main": "index.js",
  "scripts": {
    "test": "echo \"Error: no test specified\" && exit 1"
  },
  "author": "",
  "license": "ISC"
}
There is no node_modules installed and put breakpoint on any of the lines and when I run visual studio code in debug mode (Node.js) and when it hits the breakpoint as soon as I hover my mouse over the variable “myvar” it crashes the debugger
I also tried by turning on “Developer Tools” and I get following warning in console when it breaks
Error: Trying to add a disposable to a DisposableStore that has already been disposed of. The added object will be leaked!
    at d.add (lifecycle.ts:158)
    at c._register (lifecycle.ts:188)
    at actionbar.ts:271
    at Array.forEach (<anonymous>)
    at c.push (actionbar.ts:264)
    at toolbar.ts:167
    at Array.forEach (<anonymous>)
    at h.setActions (toolbar.ts:166)
    at G.setActions (viewPaneContainer.ts:485)
    at G.updateActions (viewPaneContainer.ts:499)
    at g.runner (callStackView.ts:171)
    at g.doRun (async.ts:693)
    at g.onTimeout (async.ts:687)
About this issue
- Original URL
- State: closed
- Created 4 years ago
- Comments: 16 (8 by maintainers)
@isidorn selecting “Node.js (legacy)” does not actually select the old node-debug DA (because the debug type “node” is redirected to “pwa-node” anyway. And the CALLSTACK confirms this:
js-debug shows anonymous in angle brackets (from @RealJavascriptKid’s screen cast):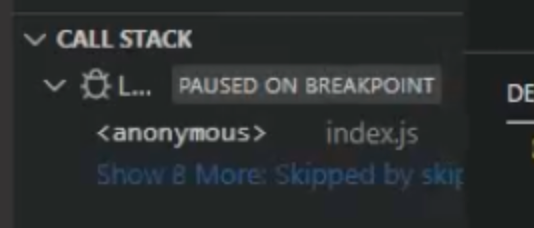
whereas node-debug2 uses parenthesis:
So there must be something else…