vscode: Unable to debug [Codespaces extension]
repro steps: 1- in latest vscode-insider version install github-codespaces extension 2- create a codespaces out of Cascade repo: https://devdiv.visualstudio.com/DevDiv/_git/Cascade 3- navigate to cascade/vscode/codespaces 4- try debugging this code
expected: -you should be able to debug with no error
actual:
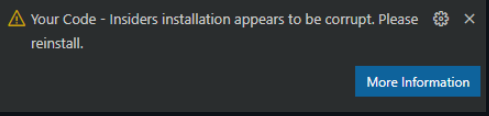
-cannot load codespaces extension due to following error:

workaround for this one based on Liveshare doc:
in windows, set the enableProposedApi to 1 in remoteExtensionHostProcess.js file
5- try debugging again after the workaround, another vscode insider would pop up, go to remote explorer 6- try creating another codespaces here(in the debugging session) OR try deleting one of the existing codespaces if you have any
expected: -you should be able to run all the codespaces commands (add, delete and etc)
actual:
- there is a warning and all commands fail with error: cannot read property ‘X’ of undifiend.
- X can be different based on which command you’ve tried to run.

About this issue
- Original URL
- State: closed
- Created 3 years ago
- Reactions: 1
- Comments: 18 (10 by maintainers)
Which is only half a fix because the instance of the vscode-module that your extension is working with is still wrong. So, all instance specific stuff, like extension storage etc, will be wrong
No error-throwing, but using the path of the file that’s calling
require. @fara-nak @aishwaryabh Do you use a node_modules that callsrequire('vscode')which is outside of your extension’s install location? Like a sym-link?