magento2: Admin dashboard order total incorrect on page load
Preconditions and environment
Magento version 2.4.5,2.4-develop PHP 8.1
1.Install Magento Instance. 2.Enable Admin dashboard Chart and use aggregated data 3.Create Orders for any product and do invoice and ship, because from completed orders we can get the Revenue. 4.Check Revenue for Today and 24hrs Timeline. 5.To see the Difference in Revenue we need to have Revenue for 24hrs and for Today(0 in my case).
Steps to reproduce
On Page load of the admin dashboard it appears the total is for the last 24hrs and not the displayed today.
1.Open admin page - Enable the chart and use aggregated data. 2.check the Today Revenue.(Revenue should be today’s revenue),it is adding 24hrs Revenue. 3.Change to 24 hrs Timeline and check Revenue. 4.Again change to Today it is adding today’s revenue.(i.e, 0 in my case). 5.Reload page and again it is adding 24hrs Revenue.
Expected result
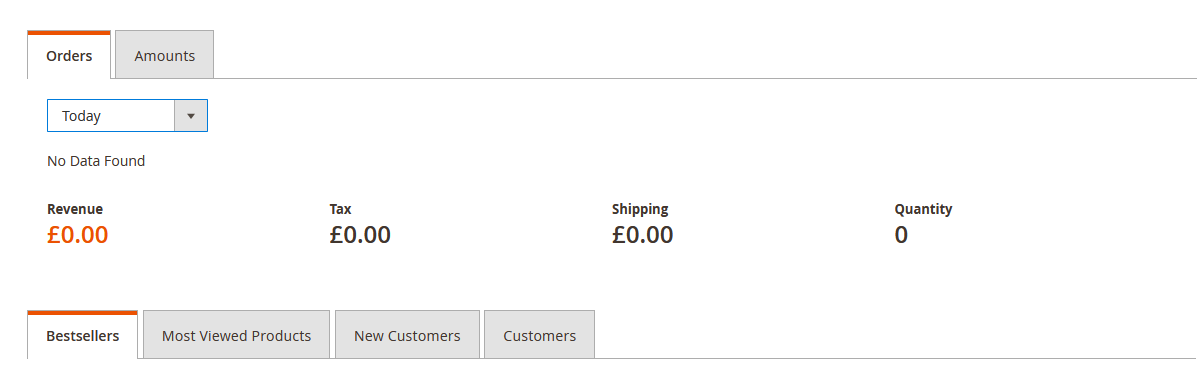
Chart and total to be in sync reflecting today, like:
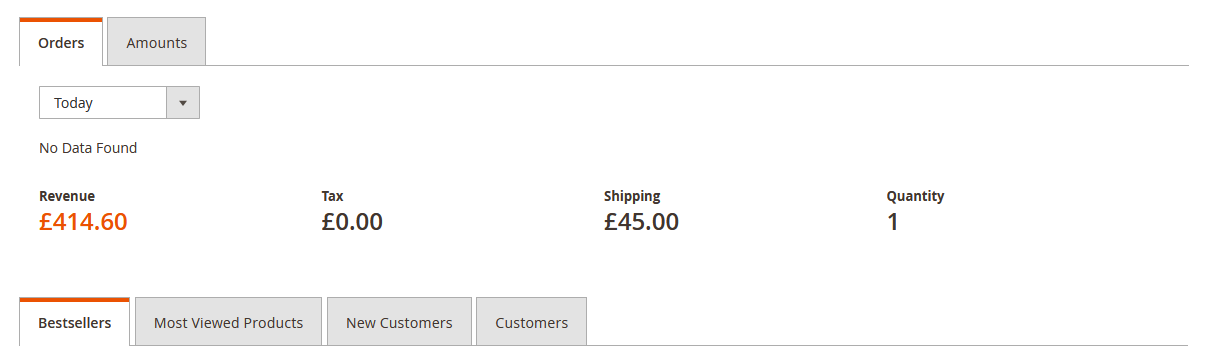
Actual result
Chart correct (nothing), total wrong:
Additional information.
Additional information
Selecting another timeframe from the option box and then reverting to today gives the correct information.
The sql select for “Today”:
SELECT SUM(main_table.total_revenue_amount) AS revenue, SUM(main_table.total_tax_amount_actual) AS tax, SUM(main_table.total_shipping_amount_actual) AS shipping, SUM(orders_count) AS quantity FROM sales_order_aggregated_created AS main_table WHERE (period >= '2023-02-16 00:00:00' AND period <= '2023-02-16 23:59:59') AND (main_table.order_status NOT IN('Canceled')) AND (store_id = '0')
And here the result without the SUM:

The sql select for “Last 24 hours”:
SELECT SUM(main_table.total_revenue_amount) AS revenue, SUM(main_table.total_tax_amount_actual) AS tax, SUM(main_table.total_shipping_amount_actual) AS shipping, SUM(orders_count) AS quantity FROM sales_order_aggregated_created AS main_table WHERE (period >= '2023-02-15 11:58:12' AND period <= '2023-02-16 11:58:12') AND (main_table.order_status NOT IN('Canceled')) AND (store_id = '0')
And here the result without the SUM:

The result stay the same and so the total values. The problem is, that the field “period” in “sales_order_aggregated_created” is a date field and not datetime. The graph is also messed up because of this problem.
Release note
No response
Triage and priority
- Severity: S0 - Affects critical data or functionality and leaves users without workaround.
- Severity: S1 - Affects critical data or functionality and forces users to employ a workaround.
- Severity: S2 - Affects non-critical data or functionality and forces users to employ a workaround.
- Severity: S3 - Affects non-critical data or functionality and does not force users to employ a workaround.
- Severity: S4 - Affects aesthetics, professional look and feel, “quality” or “usability”.
About this issue
- Original URL
- State: closed
- Created 2 years ago
- Comments: 19 (8 by maintainers)
The problem is that if no period param is added to the request, the default param is taken. And in this case it is
Period::PERIOD_24_HOURS:$period = $this->getRequest()->getParam('period', Period::PERIOD_24_HOURS);Here is the commit that will fixes the issue: https://github.com/magento/magento2/commit/dd769504d2a56e510b1632e8f1a5f42c9571af52
Hotfix: Change
$period = $this->getRequest()->getParam('period', Period::PERIOD_24_HOURS);to$period = $this->getRequest()->getParam('period', Period::PERIOD_TODAY);in File app\code\Magento\Backend\Block\Dashboard\Totals.phpHi @devchris79,
Thank you for reporting and collaboration.
Verified the issue on Magento 2.4-develop and 2.4.5 instances and the issue is reproducible on both the instances.Kindly refer the attached video.
Issue is that orders appear to be added to the numerical totals that were within the last 24hrs time .It works fine when the time selector is changed and reverted to Today Chart.
https://user-images.githubusercontent.com/51680745/193022031-4bf73f13-96b2-417c-af04-dceb300e572a.mov
Hence confirming the issue.
Thanks.