longhorn: [BUG] Engine Image, randomly readiness-probe process stuck using 1 core entirely

Describe the bug

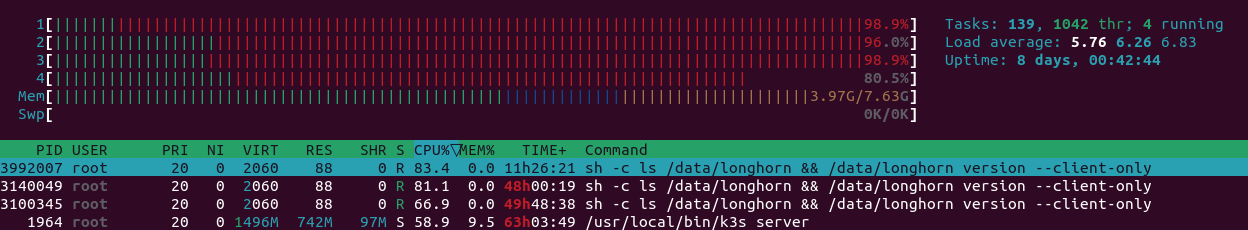
A few weeks ago I recognized an issue with a process using 1 core of the host entirely. Using htop I was able to identify the process to be sh -c ls /data/longhorn && /data/longhorn version --client-only which is the readiness probe of the engine image according to the pod’s manifest:

image: longhornio/longhorn-engine:v1.2.2                                                                                                                                                                           imagePullPolicy: IfNotPresent                                                                                                                                                                                      name: engine-image-ei-d4c780c6                                                                                                                                                                                     readinessProbe:                                                                                                                                                                                                      
  exec:                                                                                                                                                                                                                
    command:                                                                                                                                                                                                           
    - sh                                                                                                                                                                                                               
    - -c                                                                                                                                                                                                               
    - ls /data/longhorn && /data/longhorn version --client-only                                                                                                                                                      
  failureThreshold: 3                                                                                                                                                                                                
  initialDelaySeconds: 5                                                                                                                                                                                             
  periodSeconds: 5                                                                                                                                                                                                   
  successThreshold: 1                                                                                                                                                                                                
  timeoutSeconds: 4

I was not able to kill the process, just by rebooting the node I was able to get rid of it. I observed this behavior for a few weeks now and it seems that this process randomly gets stuck on some nodes. At the moment on one node I have 3 of those processes running and taking 3 cores to 100%. It is very annoying to restart the nodes each time such a process pops up and gets stuck.

image

To Reproduce

Steps to reproduce the behavior:

As this issue occurs randomly I cannot really reproduce the issue. Additionally I cannot find anything in the logs.

Expected behavior

The readiness probe process should execute and exit.

Log or Support bundle

If applicable, add the Longhorn managers’ log or support bundle when the issue happens. You can generate a Support Bundle using the link at the footer of the Longhorn UI.

Environment

  • Longhorn version: 1.2.2
  • Installation method (e.g. Rancher Catalog App/Helm/Kubectl): Helm
  • Kubernetes distro (e.g. RKE/K3s/EKS/OpenShift) and version: K3s
    • Number of management node in the cluster: 3
    • Number of worker node in the cluster: 3
  • Node config
    • OS type and version: Ubuntu 21.10 arm64
    • CPU per node: 1 CPU, 4 Cores
    • Memory per node: 8GB
    • Disk type(e.g. SSD/NVMe): USB 3 Flash
    • Network bandwidth between the nodes: 1 GBit/s
  • Underlying Infrastructure (e.g. on AWS/GCE, EKS/GKE, VMWare/KVM, Baremetal): Raspberry Pi 4B 8GB
  • Number of Longhorn volumes in the cluster: 23

Additional context

It would be interesting if someone else has the same issue and if it is probably a K3s/arm64/Raspberry Pi related issue.

About this issue

  • Original URL
  • State: open
  • Created 2 years ago
  • Reactions: 1
  • Comments: 18 (9 by maintainers)

Most upvoted comments

Yes, it cannot be killed, even with kill -9 <pid>. I just tried to kill the process that exists at the moment and it still remains. It is not a zombie process, but marked as running: image Furthermore I cannot see anything in the kern.log e.g. during kill-attempt.

I also checked the process tree and (as expected) it is derived from containerd-shim: image Here the process’ details:

root        2957  0.8  0.1 714056 13160 ?        Sl   Feb03  99:56 /var/lib/rancher/k3s/data/430c3f90e17796abd934b1d0b411bbdf418e2df313f2e4238c5218ca99fb25e7/bin/containerd-shim-runc-v2 -namespace k8s.io -id 5ffa772fa052ccec4c03f8920476e057e07a2dd7be2fb263bb2c470b7b7eb7ed -address /run/k3s/containerd/containerd.sock
root        3760  0.0  0.0   3612  2588 ?        Ss   Feb03   0:00 /bin/bash -c diff /usr/local/bin/longhorn /data/longhorn > /dev/null 2>&1; if [ $? -ne 0 ]; then cp -p /usr/local/bin/longhorn /data/ && echo installed; fi && trap 'rm /data/longhorn* && echo cleaned up' EXIT && sleep infinity
root        3892  0.0  0.0   1948   448 ?        S    Feb03   0:00 sleep infinity
root      252918 97.8  0.0   2060    88 ?        R    Feb08 4940:54 sh -c ls /data/longhorn && /data/longhorn version --client-only

On a “healthy” node this looks like the following: image

root        2814  0.8  0.1 714312 12420 ?        Sl   Feb03 108:22 /var/lib/rancher/k3s/data/430c3f90e17796abd934b1d0b411bbdf418e2df313f2e4238c5218ca99fb25e7/bin/containerd-shim-runc-v2 -namespace k8s.io -id 3aa0f94b709019000aab0cf6cb822b7a43ac38b5c57faa30b08e441055de4621 -address /run/k3s/containerd/containerd.sock
root        3635  0.0  0.0   3612  2432 ?        Ss   Feb03   0:00 /bin/bash -c diff /usr/local/bin/longhorn /data/longhorn > /dev/null 2>&1; if [ $? -ne 0 ]; then cp -p /usr/local/bin/longhorn /data/ && echo installed; fi && trap 'rm /data/longhorn* && echo cleaned up' EXIT && sleep infinity
root        3847  0.0  0.0   1948   452 ?        S    Feb03   0:00 sleep infinity

Hm, I’m not sure if this is really an issue related to longhorn. A few minutes ago I recognized a postgres process on the node where my PostgreSQL pod was running. The process uses 1 core entirely. The container itself is using 100 % of the configured cpu limit of 1. Recreating the pod helped that way that the new pod uses the expected amount of cpu. But the process still persists on the node, htop still shows it and I’m not able to kill it. I think again only a node restart can help me out.

I will try to find out if that’s probably an issue with k3s or something else.

@shuo-wu No stuck process on node03:

htop

I do not think it is related to leaked sockets. This night I observed a DeadlineExceeded on node04, currently 1 process is stuck at 100% for one core:

00:57:15.074427    1924 remote_runtime.go:394] "ExecSync cmd from runtime service failed" err="rpc error: code = DeadlineExceeded desc = context deadline exceeded" containerID="8c539b43f1dc0edd640aceafff2c0f617bbb561926004df17a35bd813122e65b" cmd=[sh -c ls /data/longhorn && /data/longhorn version --client-only]

The current socket count on node04 is still 548.

node04:~$ sudo netstat -an | wc -l
548

Actually, I encountered a similar issue in another user’s environment. The investigation is still in progress. For that case, there are tons of exec probe context deadline exceeded errors (besides this engine image readiness probe) in the kubelet logs. One ticket in Kubernetes side may be related to this bug. Can you check it and see if this issue is really caused by the socket leak?