linkerd2: Possible Memory Leak in Proxy Sidecar
Bug Report
What is the issue?
Yesterday one of our meshed services started crashlooping, because the liveness probe failed. Interestingly, because it was not able to resolve the IP of another service (java.net.UnknownHostException: xxx.default.svc.cluster.local.). The restarts did not help to recover from the problem and evenually we had to recreate the whole Pod manually. As far as I see, the health checks of our service and the proxy failed, but the proxy was never restarted.
The proxy sidecar of that Pod started to hog memory 5h30m before it failed:
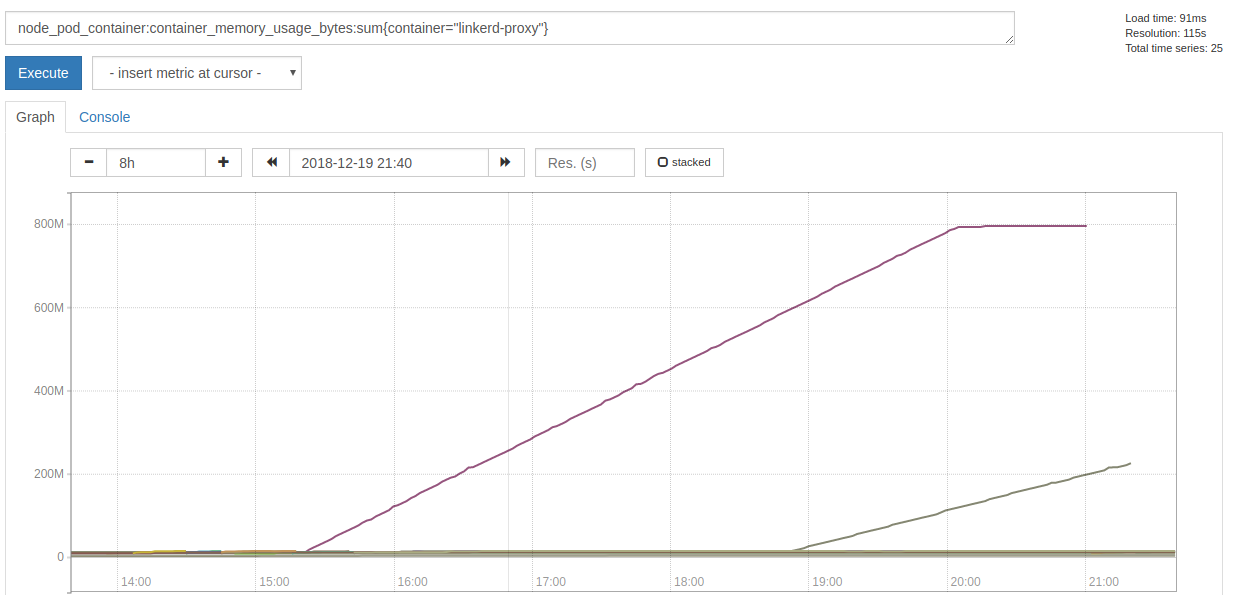
When the actual failures began, it stopped allocating memory, but spammed this error message with a rate of ~7k per second:
2018-12-19T21:01:33.000210171Z WARN trust_dns_proto::udp::udp_stream could not get next random port, delaying
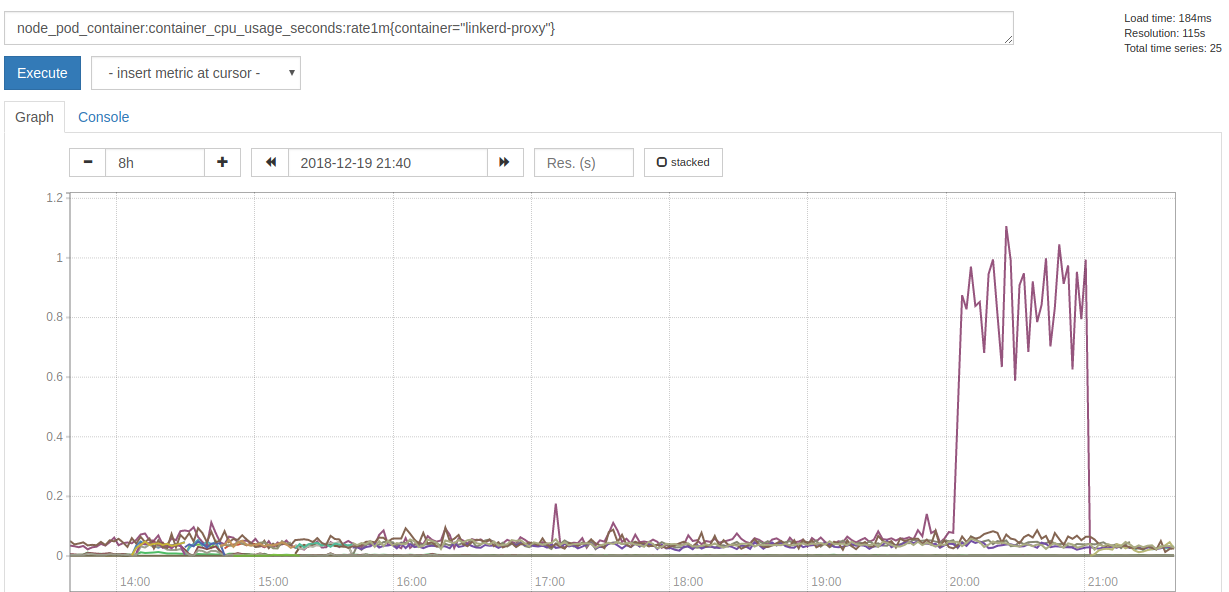
Also it consumed a lot more of CPU time:
Since the failure happeneded yesterday night, we just restarted the Pods and did not have time to collect more data and investigate further. I will collect more data, if we see a growing memory consumption again, so hints where to look at would be appreciated.
How can it be reproduced?
Unfortunately I do not know.
linkerd check output
% linkerd check
kubernetes-api: can initialize the client..................................[ok]
kubernetes-api: can query the Kubernetes API...............................[ok]
kubernetes-api: is running the minimum Kubernetes API version..............[ok]
linkerd-api: control plane namespace exists................................[ok]
linkerd-api: control plane pods are ready..................................[ok]
linkerd-api: can initialize the client.....................................[ok]
linkerd-api: can query the control plane API...............................[ok]
linkerd-api[kubernetes]: control plane can talk to Kubernetes..............[ok]
linkerd-api[prometheus]: control plane can talk to Prometheus..............[ok]
linkerd-api: no invalid service profiles...................................[ok]
linkerd-version: can determine the latest version..........................[ok]
linkerd-version: cli is up-to-date.........................................[ok]
linkerd-version: control plane is up-to-date...............................[ok]

Status check results are [ok]
Environment
- Kubernetes Version:
v1.11.5 - Cluster Environment: Built from scratch on AWS.
- Host OS:
CoreOS - Linkerd version:
2.1.0-stable
Possible solution
- restart the Pod manually
Additional context
- We only injected Linkerd into two services, yet.
- We added Linkerd yesterday morning to our production system.
- There was another proxy that kept allocation memory
- We preemtively recreated the Pod, because it was late.
- It was a different deployment, written in a different language.
- Affecected services get around 10 requests per minute.
About this issue
- Original URL
- State: closed
- Created 6 years ago
- Comments: 19 (14 by maintainers)
Commits related to this issue
- Update to trust-dns-resolver 0.10.1 This should pick up the change in bluejekyll/trust-dns#635, which fixes a UDP socket leak (bluejekyll/trust-dns#633). I suspect this is likely the cause of linkerd... — committed to linkerd/linkerd2-proxy by hawkw 5 years ago
- Update to trust-dns-resolver 0.10.1 (#169) An upstream bug in the `trust-dns-proto` library can cause `trust-dns-resolver` to leak UDP sockets when DNS queries time out. This issue appears to be th... — committed to linkerd/linkerd2-proxy by hawkw 5 years ago
- Update to trust-dns-resolver 0.10.1 (#169) An upstream bug in the `trust-dns-proto` library can cause `trust-dns-resolver` to leak UDP sockets when DNS queries time out. This issue appears to be th... — committed to panthervis/linkerd2-proxy by panthervis 5 years ago
Just wanted to let you all know that we’ve merged linkerd/linkerd2-proxy#169, and I’ll make sure this change is in tomorrow’s edge release!
I’m able to reproduce this isse (or something very similar) by installing linkerd,
kubectl execing into thelinkerd-controllerpod’s proxy container, and usingcurl --resolveto cause a DNS query for a hostname that doesn’t exist.After an hour or so, fds and memory usage for that pod start increasing out of control:
@zknill We’re targeting the next stable release for early February.
Hi
I seem to also be coming across this issue.
linkerd version: edge-18.12.3 kubernetes: 1.13.1 platform: AKS-Engine running on azure
these times are local time (utc+8) and we can see the memory usage starting to increase at 2:46am. It gets to the point where prometheus has trouble scraping the pod (healthchecks also start failing). This cluster is not live yet and no incoming requests being made.
I’ve run load tests against the pods and this does not seem to increase the memory usage.
I’ve also noticed the following in the logs around the time of the memory increase
2018-12-30T02:44:29.437 ERR! linkerd2_proxy::proxy::canonicalize failed to refine ocsp.int-x3.letsencrypt.org: deadline has elapsed
2018-12-30T02:44:32.438 WARN trust_dns_proto::xfer error notifying wait, possible future leak: Err(ProtoError { inner: requestor canceled })
2018-12-30T03:56:23.293 WARN trust_dns_proto::udp::udp_stream could not get next random port, delaying
looking at the node charts, the cpu usage was also pegged to 100% (all of the cpu load coming from this pod’s namespace). It effectively crippled 3 out of 5 nodes in the cluster.