lnd: High CPU usage after a few hours
Background
High CPU usage since 0.7.1. The node runs perfectly for a few hours and at one point the CPU usage of lnd reaches 100%, I’ve let it for a couple of days at 100% but it never goes down. Restarting lnd fixes the issue for a few hours. This behavior wasn’t seen with 0.6. bitcoind CPU usage stays low.
Your environment
- version of
lndlnd version 0.7.1-beta commit=v0.7.1-beta - which operating system (
uname -aon *Nix) Linux 4.19.0-5-amd64 #1 SMP Debian 4.19.37-5 (2019-06-19) x86_64 GNU/Linux - version of
btcd,bitcoind, or other backend Bitcoin Core Daemon version v0.18.0 - any other relevant environment details
CPU profile when it happens :

About this issue
- Original URL
- State: closed
- Created 5 years ago
- Comments: 94 (38 by maintainers)
Good news everyone! @wpaulino may have found a fundamental solution. As one would expect w/ issues like this, turns out to be a pretty small fix (like 1 line). We’re doing more testing on it, but should have a PR up soon. If it holds up, we’d like to get it into 0.10 (if not, 0.10.1).
@wpaulino, is there a reason why this has not been triaged as a bug and marked with priority? I think this is pretty serious bug, since you now need proper hardware to run lnd (embedded devices get overloaded in no time) and you cannot downgrade existing lightning node. I am getting load averages between 2-3 running just lnd (bitcoind is running on a different machine).
I hate to just complain. Tell me how to help if I can, but I never wrote a line in Go.
@alevchuk @sangaman could you test https://github.com/lightningnetwork/lnd/pull/4230? @Talkless has for the past few days and hasn’t run into any issues so far, but some more confirmation would be nice.
My BTCPAY needs almost a weekly reboot because LND end up using very high CPU
Likewise, all my nodes 100% well since the fix.
Yes, mine too.
@begetan yes, we can keep this closed. I did further investigation which revealed there were networking issues in communication between lnd and bitcoind. I had them connected via wifi with a rather weak signal (which I did not know about, but had ~10% packet loss, retransmissions, duplicate ACKs…), which evidently caused lnd to overload. After solving the networking issues it is running fine. I consulted this with @wpaulino over IRC a week ago, so mentioning it here as well. Sorry for the trouble.
Have been running #4230 for 34 hours and no issues with high load. Seems the issue is mitigated by the timeout increase. Thank you!
I’ve pasted send.firefox.com link to @wpaulino via IRC.
To those that are able to do profiles, can y’all get us the raw profile file? So not the generated svgs, but what the tool produces, then reads to render those svgs.
From @Talkless’s latest profile, it looks like his node isn’t able to keep up (malloc wise) with the load from ingesting the ZMQ information from
bitcoind. Also looking at the heap, only about 40MB is allocated, which isn’t much.If we had actionable information, it would be resolved, but if you follow the history of this issue, nothing actionable has been provided yet.
I think this is the case, as it receives a new message each time the backing full node has a new transaction added to its mempool. Overtime, we end up with numerous small-ish (few hundred bytes) allocations in the heap, which then causes a death spiral as the GC is unable to keep up with the pressure, so it then starts to consume more and more CPU in an attempt to collet everything. Perhaps all we need is a buffer pool in this area.
Well, as I said, I run lnd 24/7 on a standard desktop machine with ~600W power source, Intel i7 950 CPU with 4 cores. It has more power lnd needs, and can handle the load. However without lnd my load average is <0.1, with lnd running after several hours all cores are quite busy and load average is above 1.1. One release before the issue started occurring I had been running on a raspberry pi for about a year 24/7 without problems.
I’m one of those running lnd on a single board computer, although it’s a pretty strong cpu as far as SBCs go. I don’t think this issue should be overlooked for that reason though, as I expect that a lot of enthusiasts and individual operators will be using sbcs or similarly modest hardware. The fact that it’s happening on cloud instances as well covers a lot of other users too and means it’s not isolated to SBCs only.
This is also something that certainly is avoidable, I’ve been running lnd on the same hardware since around ~0.3 and I never used to see it. Now it hovers under 10% CPU usage for around a day, before suddenly spiking to 100%+ fully occupying one core at all times. I think any attempt to reproduce this needs to wait a couple of days (I’m past 24 hours from my last restart and still at low cpu, but I expect that will change). I realize that makes it a very tricky bug to squash, I just don’t want it to be overlooked. Thanks.
Still went into berserk mode: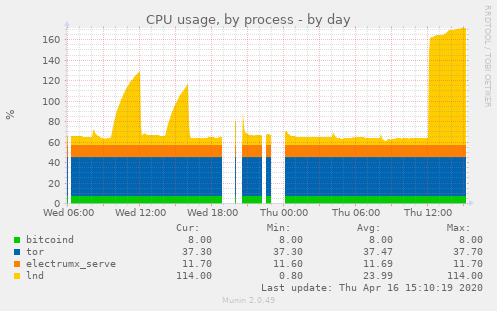
Go 1.14 included some GC enhancements, perhaps it may alleviate some of the strain in the profiles that showed the CPU mostly spending time in GC land.
Can confirm this bug is occurring for me as well. This is a huge issue for those of us running LND on cloud instances where high CPU usage is billable.
@janvojt I’ve been testing a series of patches myself along with others, but a proper fix has not been found yet. Running your
bitcoindnode withblocksonly=1and restartingbitcoindfollowed bylndshould reduce the CPU usage for now, but note that this prevents your node from forwarding incoming transactions from other peers (transactions you broadcast still propagate). As a result, yourlndnode will be unable to see an unconfirmed wallet balance.Never mind, cpu is back over 100%…
I’m seeing the same issue, lnd uses >100% cpu (1 core in constant use + light usage on other cores) after I’ve left it up and running for a few days. If I restart lnd it goes back to using low cpu (hovering between 0-20%). It also only started happening recently for me, I’d guess around the time I upgraded to 0.7.1 but it is also happening on the latest master.
I’m using a local bitcoind instance, running on an ARM ODROID-HC1 with 2 GB ram. I’d be happy to run some profiling or answer questions to help.
I’ve noticed cpu spikes too since latest beta release: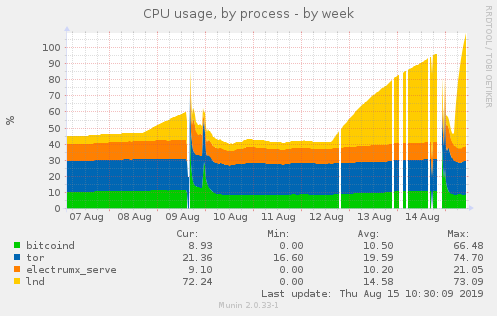
At the same time,
bitcoind(0.18.1) memory starts growing, so I assume it’s due tolndmisbehavior:And this is profile output of
curl http://localhost:9000/debug/pprof/goroutine?debug=1 > lnd_profile_output.txt:lnd_profile_output.txt
@LLeny curiously, what kind of device is this running on?
i’d guess by your description that you have a peer that requests a lot of graph data, which can a lot of allocations/deserializations as the objects are created and destroyed and gc pressure. we do keep an in-memory cache of these responses in order to avoid deserializing them every time a peer requests them, but depending on your peers or hardware, it may not be enough.
if you’re machine has enough ram, you can consider increasing the
caches.channel-cache-sizeto 35000, rather than the default of 20000. you’ll notice higher overall memory usage, but less cpu (gc + deserialization).either way you will probably want to identify which peer(s) is causing this. the logs should show something like:
thing to look for is peers that request a large
backlog_size, e.g. 50k+. if you don’t have a channel with them you can try banning their IP address. if you do, but the channel isn’t sentimental, you can try making a channel with someone else.this recent pr #3359 offers a new configuration option called
ignore-historical-filterswhich will be available in 0.8. the feature is designed to help less beefy machines avoid the heavier resource costs of syncing other peers on the network. if you’re comfortable, another possible solution is to run master and useignore-historical-filters.as noted in the PR, there are plans to remove this behavior entirely as it is quite heavy, but there are currently nodes on the network that depend on this for synchronizing the graph. you can follow the progress of its removal in this spec PR