liftbridge: replicator seems lead to high cpu when no any message publish to liftbridge
I created a stream testtlblog with 2 partitions and replica-factor is 2, after running for a while, I stopped the producer, and the liftbridge server and nats server still running. But some times later, I found high cpu occupancy with top command
And also I found massive nats communication is ongoing between liftbridge servers, look likes they are doing some job about replica.
[#25689] Received on [testlb.testtlblog.0.replicate]: ‘�C� server-2���’ [#25690] Received on [_INBOX.FRbHzl6QRyqq2LNMOKbW1m.uHyUJJr7]: ‘�C!]��’ [#25691] Received on [testlb.notify.server-2]: '�C�
testtlblog’ [#25692] Received on [testlb.testtlblog.0.replicate]: ‘�C� server-2���’ [#25693] Received on [_INBOX.FRbHzl6QRyqq2LNMOKbW1m.vGjesjOE]: ‘�C!]��’ [#25694] Received on [testlb.notify.server-2]: '�C�
testtlblog’ [#25695] Received on [testlb.testtlblog.0.replicate]: ‘�C� server-2���’ [#25696] Received on [_INBOX.FRbHzl6QRyqq2LNMOKbW1m.crJLwdFT]: ‘�C!]��’ [#25697] Received on [testlb.notify.server-2]: '�C�
I got the above infomartion by nats-sub tool. testlb is the clustering namespace, and testtlblog is the stream name
These log messages have already been cleaned when retention max age reached, how it happened? I need your help and will appreciate very much
root /opt/liftbridge# ls -l data/server-2/streams/testtlblog/0/ total 8 -rw-r–r-- 1 root root 10485760 Jan 6 18:36 00000000000559806923.index -rw-r–r-- 1 root root 0 Jan 6 18:36 00000000000559806923.log -rw------- 1 root root 17 Jan 6 18:44 leader-epoch-checkpoint -rw------- 1 root root 9 Jan 7 14:43 replication-offset-checkpoint
By the way, my liftbridge server is v1.5.0, golang version is 1.15.5
About this issue
- Original URL
- State: closed
- Created 3 years ago
- Comments: 21 (9 by maintainers)
Reproducing need more time (about 8 hours):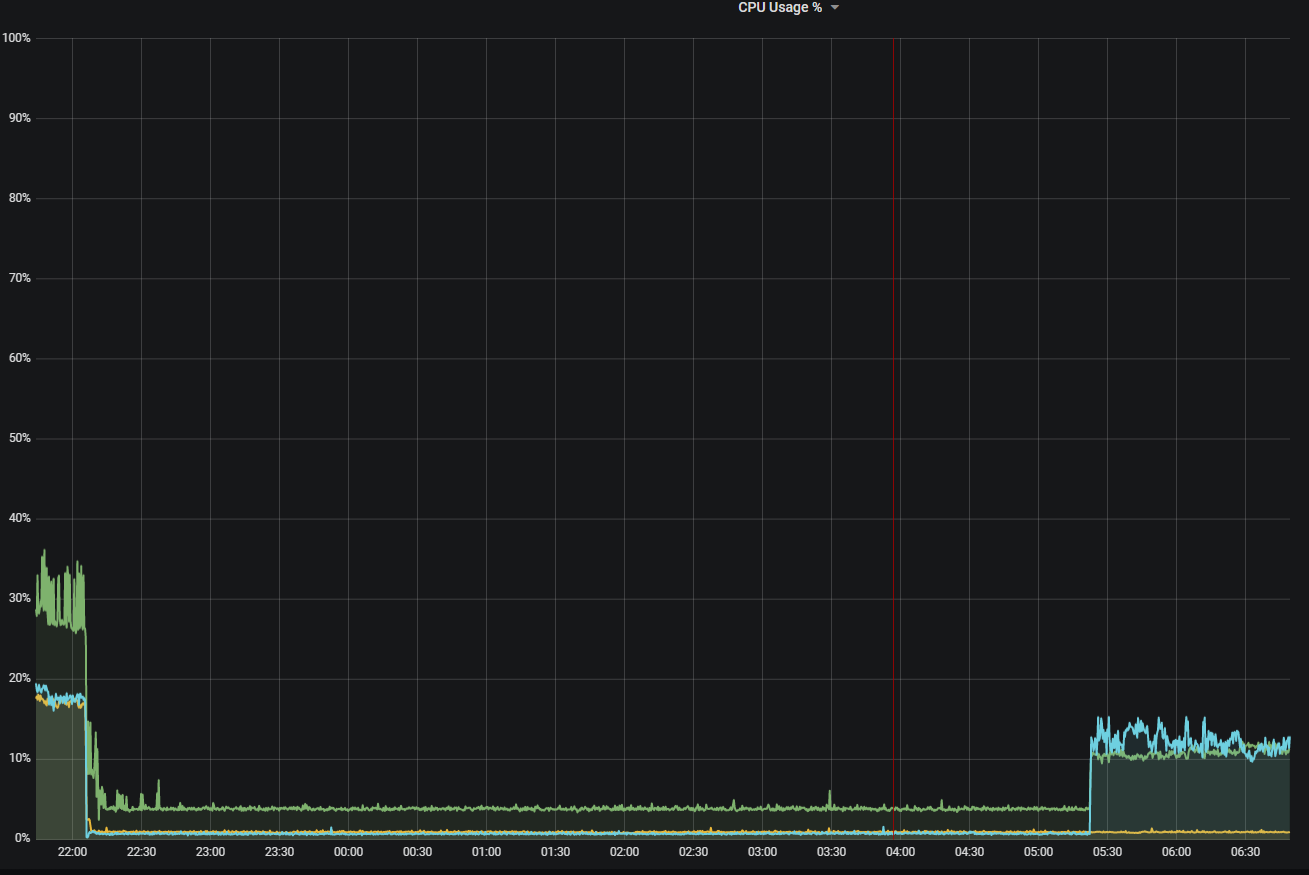
datafolderliftbridge.ymlGoing to create a patch release that will include the fix shortly.
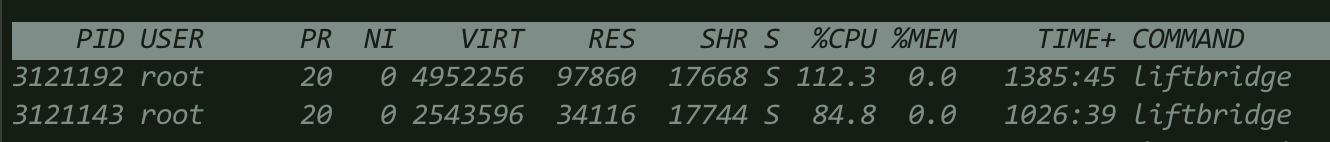
I got the following:
High CPU usage happens when LB spam message to NATS: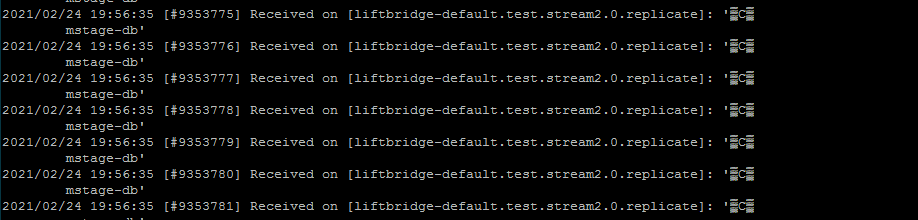
Code when generate message: Replicator caughtUp. When create segment we have:
Feb 24 20:05:47 mstage-wrk liftbridge[19222]: time="2021-02-24 20:05:47" level=debug msg="Check if we're caught up%!(EXTRA int64=-1, int64=-1)"After create stream and put 1 message (
Position: 144, LastOffset: 0):After the passage of time
segment.MaxAgeLiftbridgecreate New segment withLastOffset: -1:And call method r.partition.log.NotifyLEO(r, leo) -> NotifyLEO with params:
[NotifyLEO] param leo: 0, but new segment created with params:Position: 0, LastOffset: -1. With this call WaitForLEO and return on block:This will be repeated until a new message arrives. Then segment
LastOffsetset to 0 and the condition will stop being met and callreturn s.waitForData(waiter, s.position).The situation occurs when retention used only time (on bytes the probability is low).
I added some debug to code for logging and set
segment.MaxAgeto5 m, for speedup reproduce. Config:Sorry for the chaotic description. I can explain in more detail and attach logs if needed.
So far I’ve been unable to reproduce unfortunately. Will continue trying…