kyverno: [Bug] Memory leak causes Kyverno Pods to crash with OOMKilled in loaded conditions
Kyverno Version
1.7.0
Kubernetes Version
1.22.x
Kubernetes Platform
K3d
Kyverno Rule Type
Validate
Description
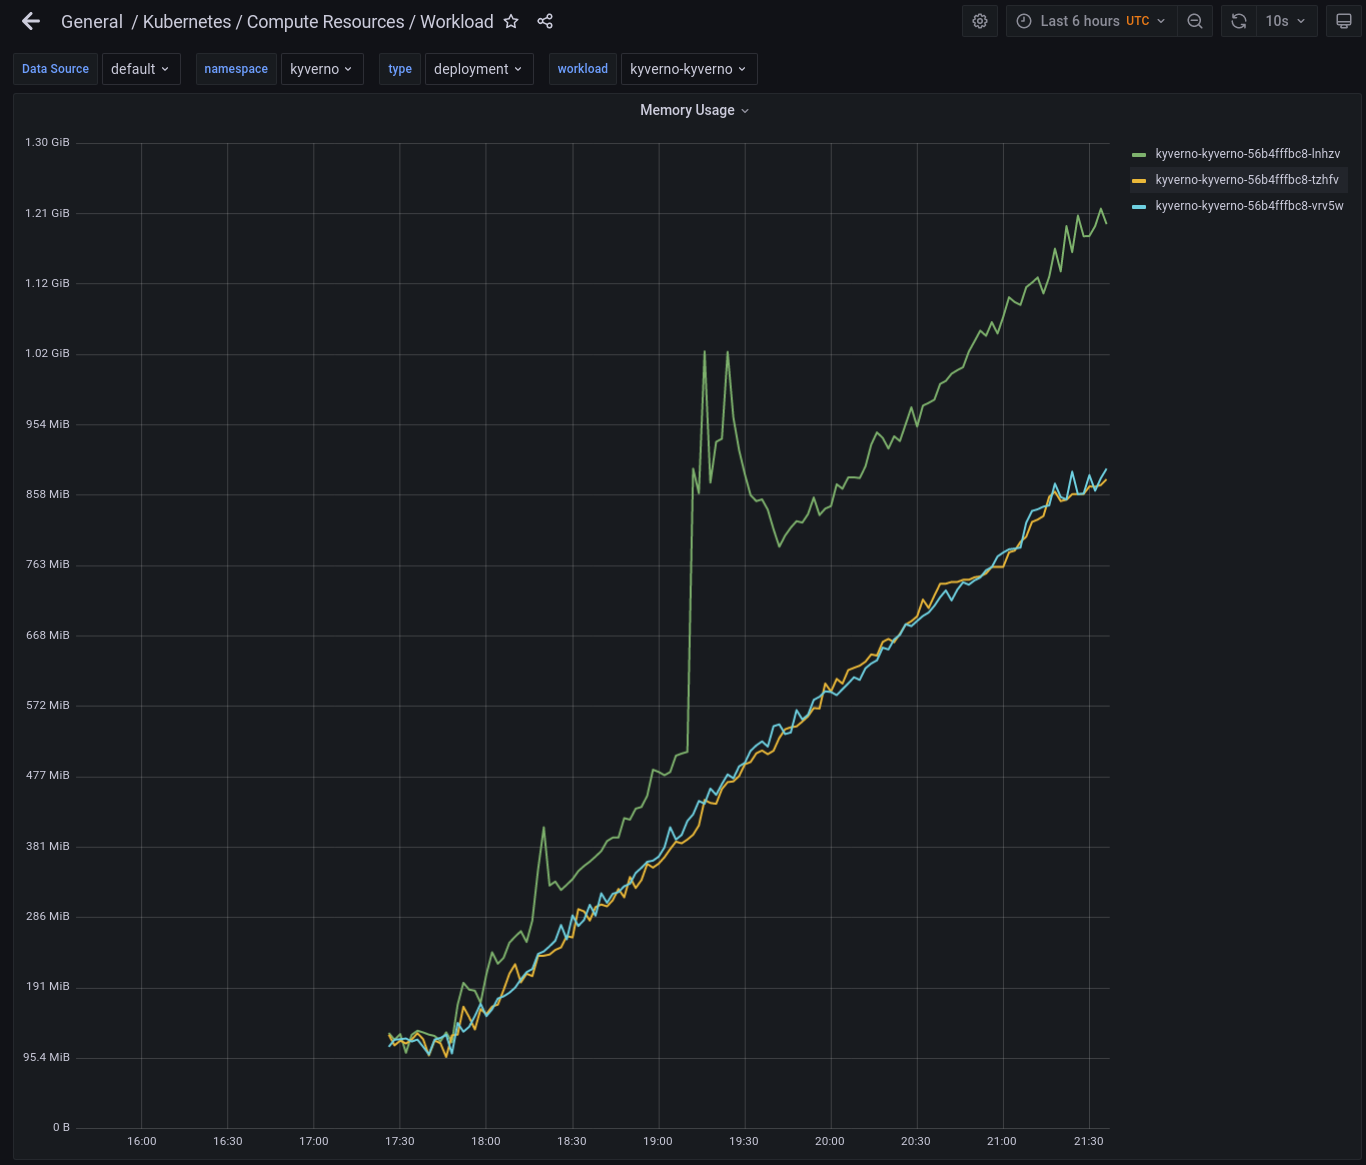
Kyverno pods steadily increase in memory over time at a rate of 200Mi to 250Mi per hour. The leader appears to grow faster than the followers. When the memory limit is reached the pod will crash with OOMKilled and restart. In some cases, the Kyverno pods will have difficulty electing a leader after the crash and never return, resulting in no admission into the cluster (if fail policy is set).
Steps to reproduce
Prereq: Kubernetes cluster with a metrics server and Prometheus/Grafana monitoring stack.
Recommend Kubernetes cluster nodes totaling 64Gi of memory and 16 vCPU. Prometheus memory limits should be 10Gi to avoid crashing
- Using Helm chart, install Kyverno 1.70 with the following overrides:
replicaCount: 3
serviceMonitor:
  enabled: true
extraArgs:
- --clientRateLimitQPS=25
- --clientRateLimitBurst=50
resources:
  limits:
    memory: 4Gi
-
Install ~25 validation policies (About 20 of mine are in enforce mode, and 5 in audit)
-
Open Grafana and go to the “General > Kubernetes > Compute Resources > Workload” dashboard. Set the namespace to Kyverno and type to Deployment. This will allow you to monitor CPU and Memory use for Kyverno pods
-
Create a test namespace:
kubectl create ns test -
Run the following load to simulate a cluster performing a bunch of nightly build pipelines. This will add jobs to the cluster to keep 50-60 running simultaneously. Each job uses busybox to sleep for 40 seconds.
#!/bin/bash

for i in {1..500000}; do
  CURRJOBS=$(kubectl get jobs -n test -o name | wc -l)
  NEWJOBS=$((60-CURRJOBS))
  if [ "$NEWJOBS" -ge 1 ]; then
    for (( c=1; c<=$NEWJOBS; c++ )); do
      NAME=$(cat /dev/urandom | tr -cd 'a-f0-9' | head -c 32)

echo "apiVersion: batch/v1
kind: Job
metadata:
  name: $NAME
spec:
  template:
    spec:
      containers:
      - image: busybox:1
        name: $NAME
        command:
        - sleep
        - '40'
      restartPolicy: Never
  ttlSecondsAfterFinished: 0" | kubectl apply -n test -f - &
    done
  fi
  sleep 5
done
- Monitor memory usage over several hours.
Expected behavior
Memory should reach a steady state and not continue to grow indefinitely.
Screenshots
Kyverno logs
No response
Slack discussion
No response
Troubleshooting
- I have read and followed the documentation AND the troubleshooting guide.
- I have searched other issues in this repository and mine is not recorded.
About this issue
- Original URL
- State: closed
- Created 2 years ago
- Reactions: 8
- Comments: 76 (60 by maintainers)
Here’s the result running
v1.7.2-rc2.Test env:
There was no restart on Kyverno pod:
Policy reports were updated properly:
The memory usage was between 200 Mi - 300 Mi in 5 hours.
Here’s the memory usage for HA (3 replicas) overnight:
Hi @pierluigilenoci - we are performing the final round of testing, the official release will be available early next week if no critical issues are found.
We had a similar issue running Kyverno version 1.7.1. It was solved also solved by upgrading to version 1.7.2 (helm chart version 2.5.2)
What is shown is memory usage by Kyverno pods with restarts (due to being OOM killed) represented as straight pins. Woohoo!
You don’t know until you update the policy to be “correct” based upon your use case. We can go from there.
With the following set up I was able to reproduce the memory increase issue, however, there were no stale RCRs piled up in my test scenario.
My setup:
From my previous observation, the memory increased due to a flood of events (frequent admission requests) to be created in the cluster. And since the job in the script has TTL=0, all events creation failed due to the source resource cannot be found thus kyverno kept retrying until hit the max retry count.
The 1) first test I did was to increase the events generator worker to 10 to speed up the events processing and let kyverno run overnight, the memory was increased from 120Mi to 2.8Gi. The last observed event info count in the queue is 2849481. After stopped loads, this number decreased slowly but took hours to process 100k events.
Here’s the heap comparison between step 3 and step 2 as described on this page Troubleshoot Kyverno memory issue, it clearly shows that the event generator took up the memory:
profile013.pdf
The 2) second test I did was with the following fixes on the release-1.7 branch, the memory usage is fairly stable (starts at 07/13 12:00):
Now with the first two fixes in-place in the release-1.7 branch,
we are working on speeding up events processing by making the number of event workers configurable so that the user can tune it in different scenarios. This didn’t solve the issue, see #4218.@realshuting Just saw your request. I’ll get that kicked off and report back when I have some results
I ran the simulation overnight and the pods crashed at the 4Gi limit I had set. I was incorrect in stating they cannot elect a leader. Instead, when they restart, they immediately shoot up to 4Gi of memory and crash again. All 3 pods crash over and over again, preventing the admission controller from getting a response from Kyverno.