kyverno: [Bug] Huge discrepancy between kyverno review duration and kube-apiserver request duration
Kyverno Version
1.8.5
Kubernetes Version
1.23.x
Kubernetes Platform
EKS
Kyverno Rule Type
Validate
Description
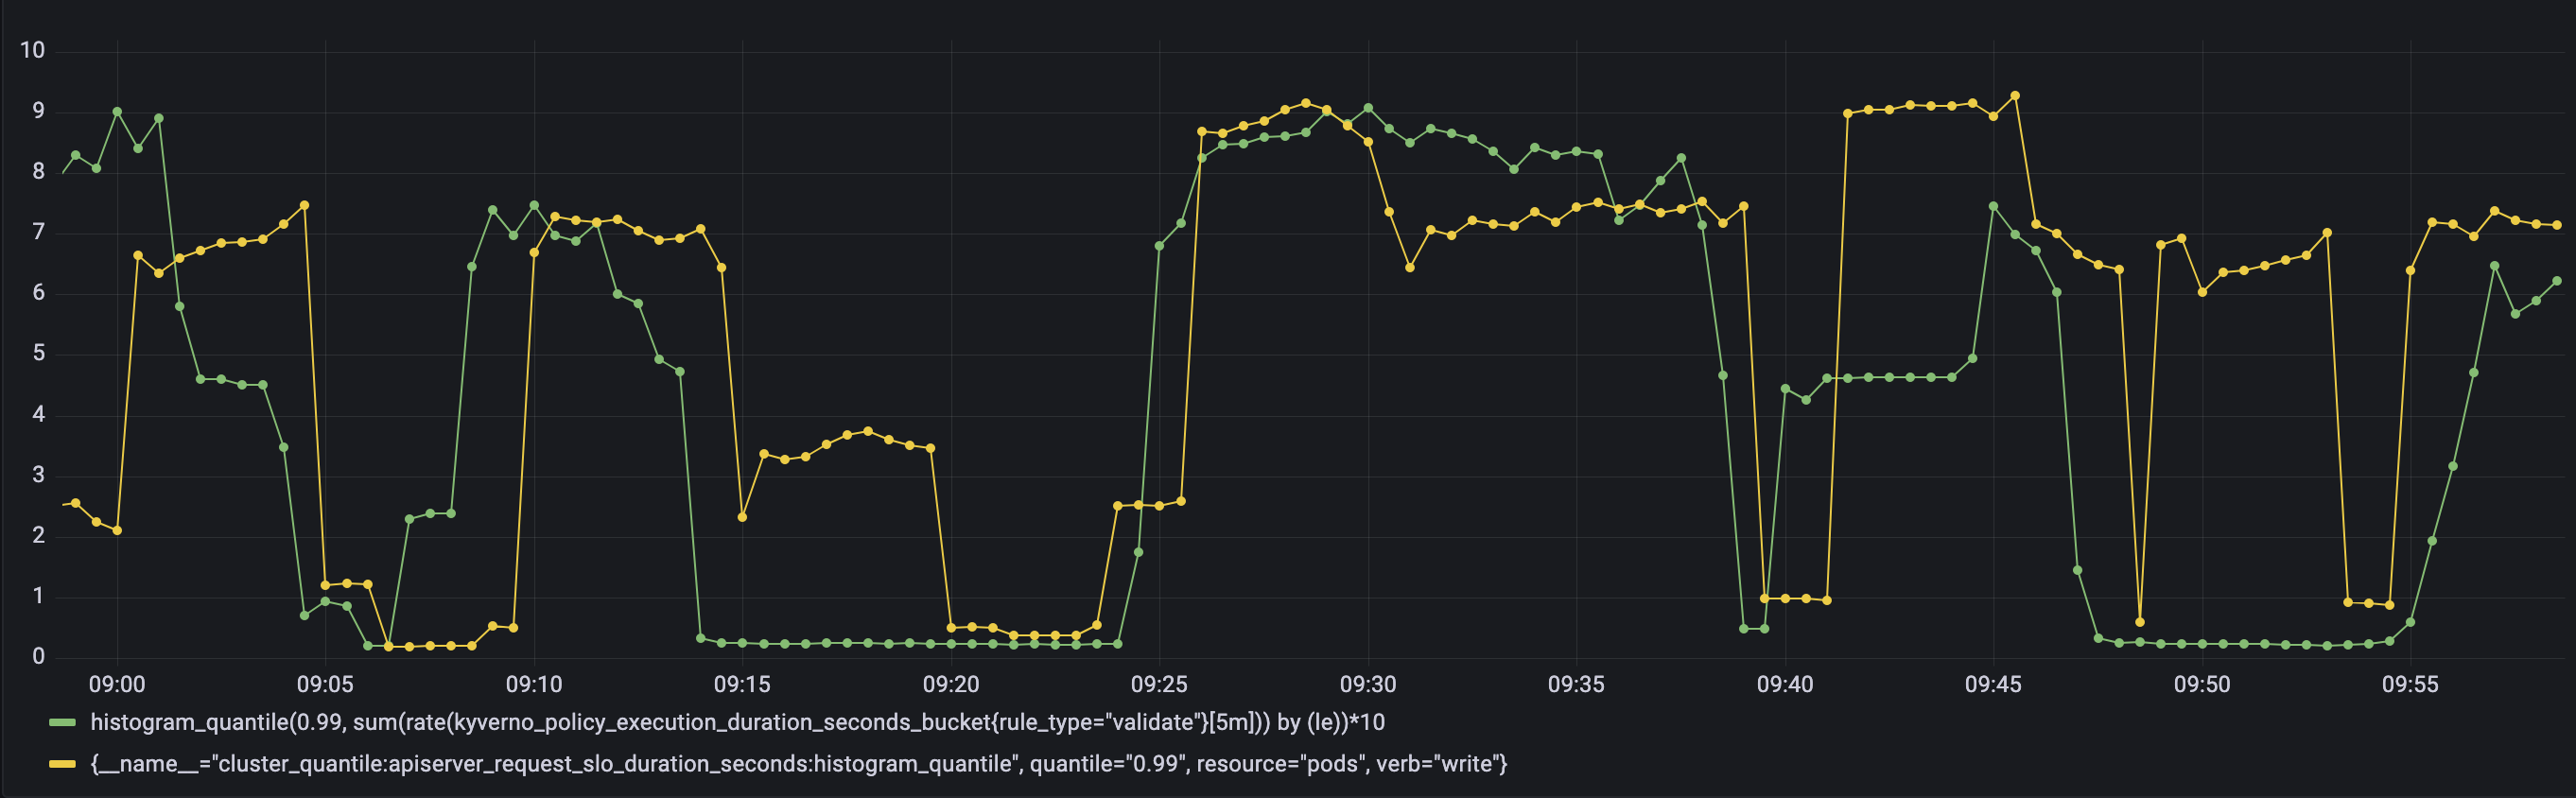
I am comparing two metrics,
histogram_quantile(0.99, sum(rate(kyverno_policy_execution_duration_seconds_bucket{}[5m])) by (le))kyverno’s p99 rule durationcluster_quantile:apiserver_request_slo_duration_seconds:histogram_quantile{verb="write", cluster="", resource="pods"}kube-api’s p99 pod write duration
Once kyverno was enabled, pod write duration went from a max of 0.6s to anywhere between 1-12s.
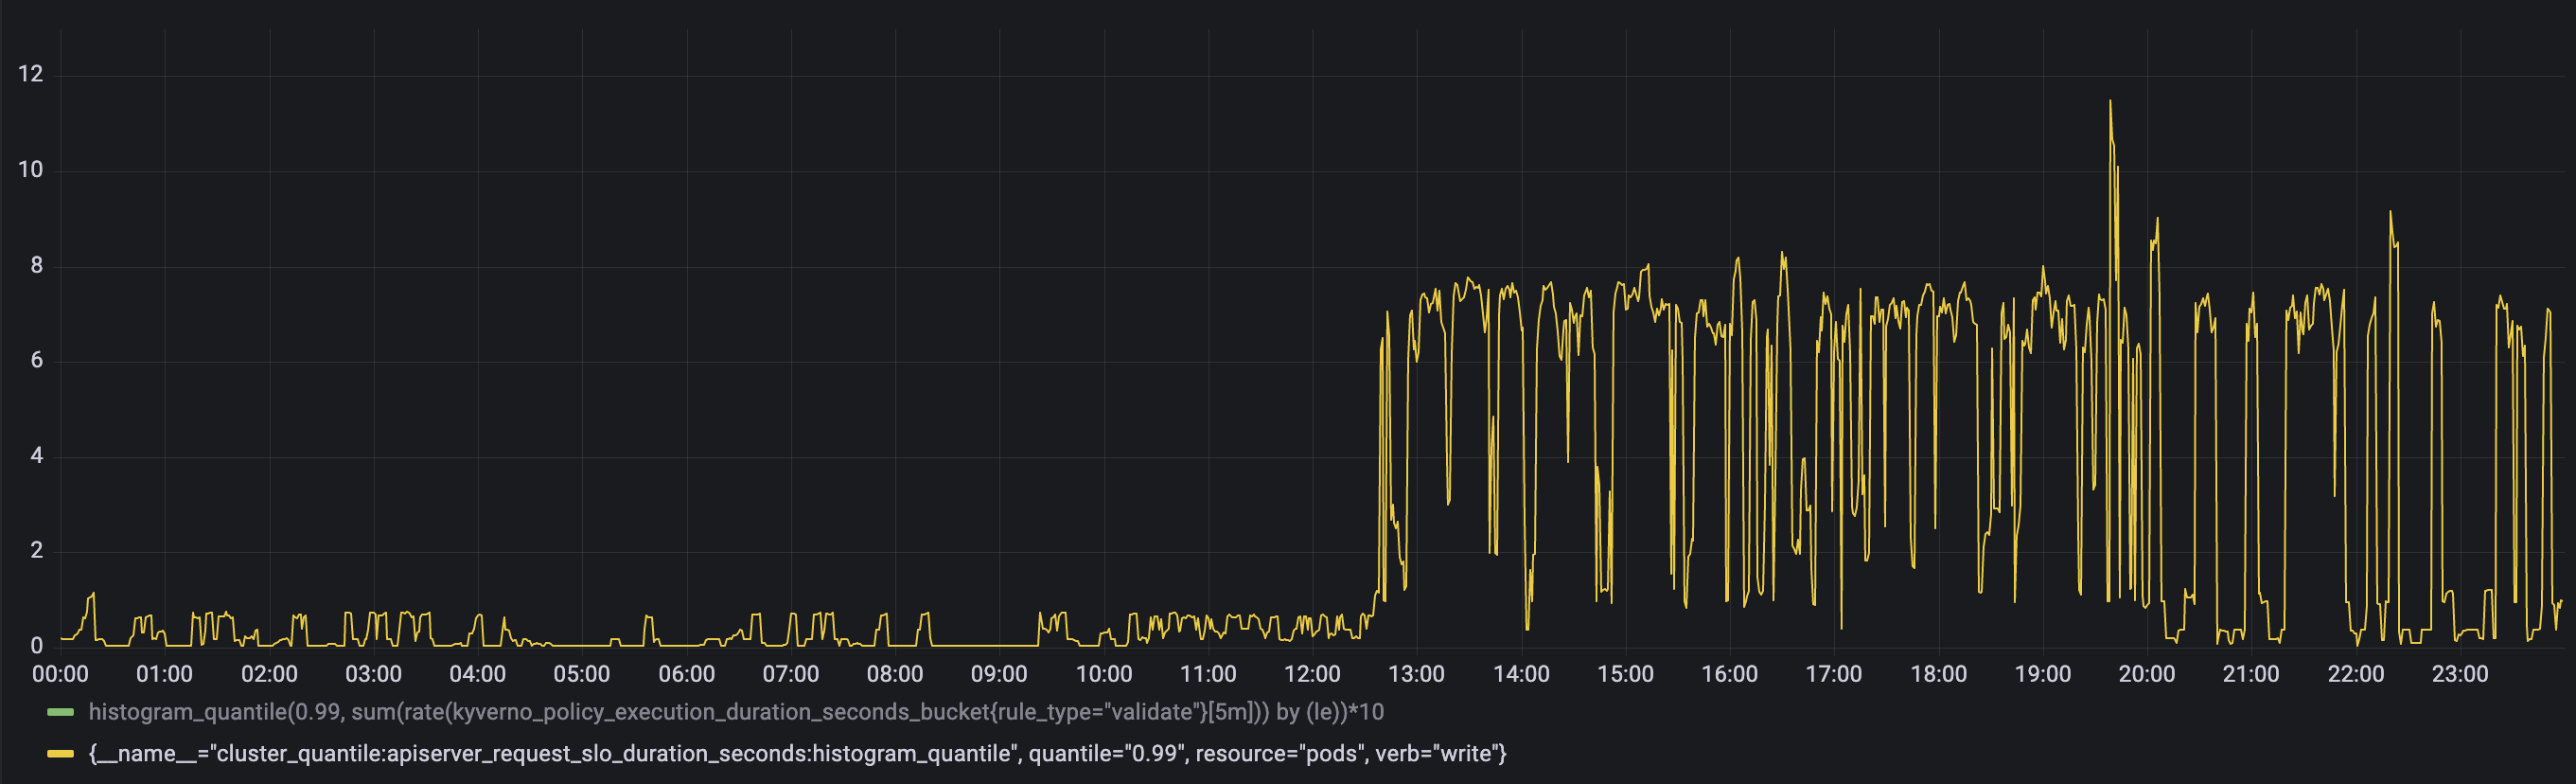
Meanwhile, kyverno’s self-reported duration is between 0.1 and 0.10 seconds. What’s interesting is that by multiplying kyverno’s metric by 10, the timeseries actually line up pretty well.
The discrepancy is so severe, it makes me wonder if the kyverno metric is accidentally in the wrong units or something.
What’s driving this investigation is that the admission webhook is timing out about 5% of the time with the default 10s timeout. (I had to set the webhook to fail-open to stop the errors.) If executions truly have sub-second performance, I’d expect 0%.
Background scans are turned off, and so is reporting. All we have are 11 ClusterPolicies (the baseline pod security standards). Kyverno has 3 replicas, 4 CPU requests, and no limits.
Steps to reproduce
- Turn on kyverno
- Apply some ClusterPolicies
- Compare kube-apiserver latency metrics with kyverno latency metrics
Expected behavior
I would expect kyverno latency metrics to not show a 10x difference to kube-apiserver’s.
Actually, the discrepancy is even worse if I look at kyverno_admission_review_duration_seconds_bucket. That metric shows 100x better performance than kube-apiserver. If policy execution duration is the latency of individual rules within a policy, and admission review duration is the combined latency of all those rules during an admission review, I don’t understand how the combined duration can be 10x faster than the individual rule duration.
Screenshots
inline above
Kyverno logs
There is no throttling in kyverno logs.
Slack discussion
No response
Troubleshooting
- I have read and followed the documentation AND the troubleshooting guide.
- I have searched other issues in this repository and mine is not recorded.
About this issue
- Original URL
- State: closed
- Created a year ago
- Comments: 23 (15 by maintainers)
I tried 1.9.2 in a test cluster and now I see the proper relationships between these metrics! 🎉
kyverno policy execution < kyverno admission duration ≈ apiserver admission durationWith
apiserver_request_duration_secondsinstead ofapiserver_request_slo_duration_secondsit looks correct.Not really, it’s just a name i gave to the grafana query:
kyverno_policy_execution_duration_seconds_sumissum(rate(kyverno_policy_execution_duration_seconds_sum[5m])) / sum(rate(kyverno_policy_execution_duration_seconds_count[5m]))kyverno_admission_review_duration_seconds_sumissum(rate(kyverno_admission_review_duration_seconds_sum[5m])) / sum(rate(kyverno_admission_review_duration_seconds_count[5m]))Chances are that all 1.8 versions are affected