kyverno: [Bug] High memory consumption
Kyverno Version
1.8.2
Description
Hi, we have seen an unusual high memory consumption of our Kyverno instances running in our cluster. Thus they often get killed because of OOM.
Maybe there is some kind of memory leak or so in the current version?
Version: 1.8.2 Cluster policies: 13 Rules: 57 Rate incoming admission requests (per 5m): 523 Number of CM, Secrts: 2039
Request memory: 1G Limit memory: 4G Args:
        - '--autogenInternals=true'
        - '--loggingFormat=text'
        - '--reportsChunkSize=200'
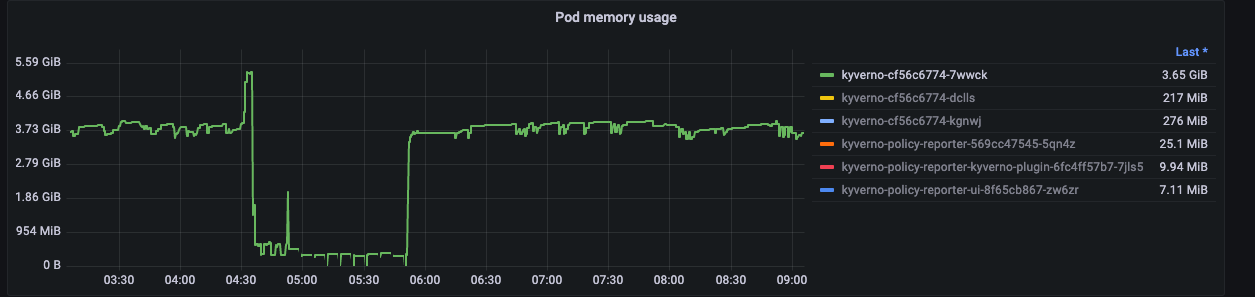
In the Graph we see that kyverno is consuming the whole time around 4g but then spikes up another 2g roughly. Also its going to OOM after the first OOM again and again till its recovering after a few times.
For me this looks like there is a major bug in how memory is used in Kyverno. I’m curious why it consumes so much memory the whole time and why is has so high spikes. IMHO our cluster is not that huge and it should be possible for Kyverno to handle this with easy without giving it tons of memory.
Using the pprof the only interesting i can could found was this:
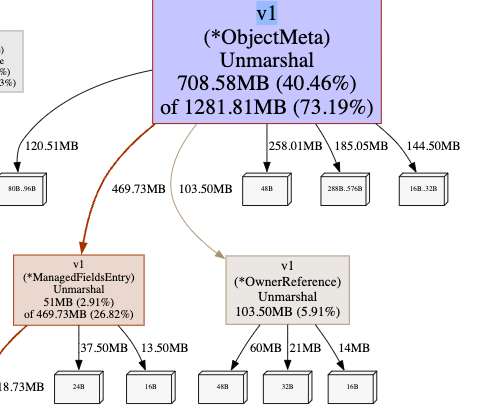
But i’m not really sure where to look at as i’m not familiar with Golang profiling
Do you have any idea what is happening here?
Best regards eloo
Slack discussion
No response
Troubleshooting
- I have read and followed the documentation AND the troubleshooting guide.
- I have searched other issues in this repository and mine is not recorded.
About this issue
- Original URL
- State: closed
- Created 2 years ago
- Comments: 46 (36 by maintainers)
Thanks for advice @chipzoller, we just tried to upgrade and here are the results:
Kyverno
1.8.5vs1.9.0. cc @developer-guyIt seems the memory leak issue was resolved. We still do actively monitor Kyverno deployments on production clusters, thanks!
We fixed some issues that we left behind in 1.9. I’d urge you to try the latest RC for 1.9 and see how these graphs change. The GA release will be soon.
thanks for releasing 1.8.3 so fast 😃 just deployed to our clusters and now it looks stable again 😃
thanks
It seems the leak issue was resolved!
In the picture below, you can see the CPU/MEM for a peak sample time frame. As you might notice, there are CPU/MEM spikes roughly every hour.
Is it something background scan interval as we passed here as
reconcilePeriod? Eventually it runs requeuePolicies() every hour. That function feeds the queue to process later on at syncPolicy(). AlsoupdateUR()do lots of work.So I’m curious what causes the peaks in this situation. It’s because API requests or something internal detail?
Kyverno already using rate-limited workqueue for enqueue’ing but there are 2 workers that working simultaneously during the process. So in order to avoid the immediate CPU brust, wouldn’t using a rate-limiter work in this case? To make it more resilient and stable by using a token bucket.
I’m more inclined to see a maximum 512Mi CPU spread for 30 seconds instead of process all the queue in a few sec.
The follow-up actions would be:
Wdyt? @realshuting @eddycharly
Yes, it’s expected that the leader consumes more memory, only the leader runs leader controllers and that’s why memory consumption is higher on the leader.
We made significant changes in 1.8.x regarding the memory issue and suggest testing out 1.8+.
You can ask kyverno to log requests (this will show the user making the request in the payload).
Critical fix https://github.com/kyverno/kyverno/pull/5525 🙈 Will come with 1.8.3 RC2 tomorrow !
Again, we had a design issue, we didn’t expect the same resource to be continuously but this can clearly happen and in this case we didn’t cleanup admission reports (because the issue didn’t change and we considered the report valid).
The design changed in 1.8.3 to a more robust approach.