prometheus-adapter: apiserver was unable to write a JSON response: http2: stream closed
What happened? Deploy prometheus adapter with kube-prometheus Got below error in prometheus adapter pod log(repeat every 30 seconds):
I0506 11:28:29.190304       1 adapter.go:93] successfully using in-cluster auth
I0506 11:28:29.624391       1 serving.go:273] Generated self-signed cert (/var/run/serving-cert/apiserver.crt, /var/run/serving-cert/apiserver.key)
I0506 11:28:30.131352       1 serve.go:96] Serving securely on [::]:6443
E0506 11:28:53.628657       1 writers.go:149] apiserver was unable to write a JSON response: http2: stream closed
E0506 11:28:53.628687       1 status.go:64] apiserver received an error that is not an metav1.Status: &errors.errorString{s:"http2: stream closed"}
E0506 11:28:53.628699       1 writers.go:149] apiserver was unable to write a JSON response: http2: stream closed
E0506 11:28:53.630557       1 writers.go:149] apiserver was unable to write a JSON response: http2: stream closed
E0506 11:28:53.630851       1 status.go:64] apiserver received an error that is not an metav1.Status: &errors.errorString{s:"http2: stream closed"}
E0506 11:28:53.632975       1 status.go:64] apiserver received an error that is not an metav1.Status: &errors.errorString{s:"http2: stream closed"}
Did you expect to see some different? No errors
How to reproduce it (as minimally and precisely as possible): kubectl apply -f manifests
Environment
- Prometheus Adapter version: v0.5.0 , Same issue with v0.6.0, adapter log similar error and then panics with v0.7.0 , error logs are
I0507 04:28:55.121299       1 dynamic_serving_content.go:129] Starting serving-cert::/var/run/serving-cert/apiserver.crt::/var/run/serving-cert/apiserver.key
I0507 04:28:55.121318       1 tlsconfig.go:219] Starting DynamicServingCertificateController
I0507 04:28:55.121548       1 configmap_cafile_content.go:205] Starting client-ca::kube-system::extension-apiserver-authentication::client-ca-file
I0507 04:28:55.121558       1 shared_informer.go:197] Waiting for caches to sync for client-ca::kube-system::extension-apiserver-authentication::client-ca-file
I0507 04:28:55.221420       1 shared_informer.go:204] Caches are synced for client-ca::kube-system::extension-apiserver-authentication::requestheader-client-ca-file
I0507 04:28:55.221677       1 shared_informer.go:204] Caches are synced for client-ca::kube-system::extension-apiserver-authentication::client-ca-file
E0507 04:29:23.979358       1 writers.go:105] apiserver was unable to write a JSON response: http2: stream closed
E0507 04:29:23.979384       1 status.go:71] apiserver received an error that is not an metav1.Status: &errors.errorString{s:"http2: stream closed"}
E0507 04:29:23.980432       1 writers.go:105] apiserver was unable to write a JSON response: http2: stream closed
E0507 04:29:23.980764       1 runtime.go:76] Observed a panic: runtime error: invalid memory address or nil pointer dereference
goroutine 356 [running]:
k8s.io/apiserver/pkg/server/filters.(*timeoutHandler).ServeHTTP.func1.1(0xc0033c0180)
	/home/sur/src/redhat/go/pkg/mod/k8s.io/apiserver@v0.17.3/pkg/server/filters/timeout.go:108 +0x107
panic(0x1861bc0, 0x2a840f0)
	/usr/lib/golang/src/runtime/panic.go:679 +0x1b2
compress/gzip.(*Writer).Write(0xc003226000, 0xc003388f80, 0x71, 0x71, 0x30, 0x1920b00, 0xc0037a8d01)
	/usr/lib/golang/src/compress/gzip/gzip.go:168 +0x237
k8s.io/apiserver/pkg/endpoints/handlers/responsewriters.(*deferredResponseWriter).Write(0xc001ebc0a0, 0xc003388f80, 0x71, 0x71, 0xc003388f80, 0x71, 0x71)
	/home/sur/src/redhat/go/pkg/mod/k8s.io/apiserver@v0.17.3/pkg/endpoints/handlers/responsewriters/writers.go:182 +0x54e
k8s.io/apiserver/pkg/endpoints/handlers/responsewriters.SerializeObject(0x1ab3a63, 0x10, 0x7fa9dc4292c8, 0xc002b481e0, 0x7fa9dc6a8ed8, 0xc0001fc020, 0xc003646300, 0xc8, 0x1d597a0, 0xc001ebc050)
	/home/sur/src/redhat/go/pkg/mod/k8s.io/apiserver@v0.17.3/pkg/endpoints/handlers/responsewriters/writers.go:117 +0x389
k8s.io/apiserver/pkg/endpoints/handlers/responsewriters.WriteObjectNegotiated(0x1d8e6e0, 0xc0005d50e0, 0x1d8e920, 0x2ac4d18, 0x0, 0x0, 0x0, 0x0, 0x7fa9dc6a8ed8, 0xc0001fc020, ...)
	/home/sur/src/redhat/go/pkg/mod/k8s.io/apiserver@v0.17.3/pkg/endpoints/handlers/responsewriters/writers.go:251 +0x555
k8s.io/apiserver/pkg/endpoints/discovery.(*APIVersionHandler).ServeHTTP(0xc003a22d80, 0x7fa9dc6a8ed8, 0xc0001fc020, 0xc003646300)
	/home/sur/src/redhat/go/pkg/mod/k8s.io/apiserver@v0.17.3/pkg/endpoints/discovery/version.go:81 +0x18f
k8s.io/apiserver/pkg/endpoints/discovery.(*APIVersionHandler).handle(...)
	/home/sur/src/redhat/go/pkg/mod/k8s.io/apiserver@v0.17.3/pkg/endpoints/discovery/version.go:77
github.com/emicklei/go-restful.(*Container).dispatch(0xc0005579e0, 0x7fa9dc6a8ed8, 0xc0001fc020, 0xc003646300)
	/home/sur/src/redhat/go/pkg/mod/github.com/emicklei/go-restful@v2.9.5+incompatible/container.go:288 +0xa4f
github.com/emicklei/go-restful.(*Container).Dispatch(...)
	/home/sur/src/redhat/go/pkg/mod/github.com/emicklei/go-restful@v2.9.5+incompatible/container.go:199
k8s.io/apiserver/pkg/server.director.ServeHTTP(0x1ac198d, 0x1a, 0xc0005579e0, 0xc0004bebd0, 0x7fa9dc6a8ed8, 0xc0001fc020, 0xc003646300)
	/home/sur/src/redhat/go/pkg/mod/k8s.io/apiserver@v0.17.3/pkg/server/handler.go:146 +0x4d3
k8s.io/apiserver/pkg/endpoints/filters.WithAuthorization.func1(0x7fa9dc6a8ed8, 0xc0001fc020, 0xc003646300)
	/home/sur/src/redhat/go/pkg/mod/k8s.io/apiserver@v0.17.3/pkg/endpoints/filters/authorization.go:64 +0x512
net/http.HandlerFunc.ServeHTTP(0xc000491dc0, 0x7fa9dc6a8ed8, 0xc0001fc020, 0xc003646300)
	/usr/lib/golang/src/net/http/server.go:2007 +0x44
k8s.io/apiserver/pkg/server/filters.WithMaxInFlightLimit.func1(0x7fa9dc6a8ed8, 0xc0001fc020, 0xc003646300)
	/home/sur/src/redhat/go/pkg/mod/k8s.io/apiserver@v0.17.3/pkg/server/filters/maxinflight.go:160 +0x5dc
net/http.HandlerFunc.ServeHTTP(0xc001cdc750, 0x7fa9dc6a8ed8, 0xc0001fc020, 0xc003646300)
	/usr/lib/golang/src/net/http/server.go:2007 +0x44
k8s.io/apiserver/pkg/endpoints/filters.WithImpersonation.func1(0x7fa9dc6a8ed8, 0xc0001fc020, 0xc003646300)
	/home/sur/src/redhat/go/pkg/mod/k8s.io/apiserver@v0.17.3/pkg/endpoints/filters/impersonation.go:50 +0x1fe6
net/http.HandlerFunc.ServeHTTP(0xc000491e00, 0x7fa9dc6a8ed8, 0xc0001fc020, 0xc003646300)
	/usr/lib/golang/src/net/http/server.go:2007 +0x44
k8s.io/apiserver/pkg/endpoints/filters.WithAuthentication.func1(0x7fa9dc6a8ed8, 0xc0001fc020, 0xc003646200)
	/home/sur/src/redhat/go/pkg/mod/k8s.io/apiserver@v0.17.3/pkg/endpoints/filters/authentication.go:131 +0xa8c
net/http.HandlerFunc.ServeHTTP(0xc0004cf4a0, 0x7fa9dc6a8ed8, 0xc0001fc020, 0xc003646200)
	/usr/lib/golang/src/net/http/server.go:2007 +0x44
k8s.io/apiserver/pkg/server/filters.(*timeoutHandler).ServeHTTP.func1(0xc0033c0180, 0xc001cd69c0, 0x1d93160, 0xc0001fc020, 0xc003646200)
	/home/sur/src/redhat/go/pkg/mod/k8s.io/apiserver@v0.17.3/pkg/server/filters/timeout.go:113 +0xd0
created by k8s.io/apiserver/pkg/server/filters.(*timeoutHandler).ServeHTTP
	/home/sur/src/redhat/go/pkg/mod/k8s.io/apiserver@v0.17.3/pkg/server/filters/timeout.go:99 +0x1cb
-
Prometheus Operator version:
v0.38.1
-
Kubernetes version information:
v1.17.3
-
Similar issue found https://github.com/helm/charts/issues/18576
About this issue
- Original URL
- State: closed
- Created 4 years ago
- Reactions: 19
- Comments: 63 (18 by maintainers)
I’m also facing the same issues. is there any solution, please. prometheus-adapter:v0.9.1 and Kubernetes v1.21.5 error : apiserver received an error that is not an metav1.Status: &errors.errorString{s:“http2: stream closed”}
We had some issue on “AKS version 1.21.2” and Prometheus adaptor version v0.9.0.
Part of the log
E0602 00:10:39.074807 1 writers.go:117] apiserver was unable to write a JSON response: http2: stream closed I0602 00:10:39.074834 1 panic.go:965] “HTTP” verb=“GET” URI=“/apis/custom.metrics.k8s.io/v1beta1” latency=“11.302014ms” userAgent=“Go-http-client/2.0” audit-ID=“4a2e6a4b-d1ef-4da0-a8c0-4e84c27615ce” srcIP=“10.254.1.1:51580” resp=200 E0602 00:10:39.074845 1 status.go:71] apiserver received an error that is not an metav1.Status: &errors.errorString{s:“http2: stream closed”}: http2: stream closed E0602 00:10:39.074880 1 wrap.go:54] timeout or abort while handling: method=GET URI=“/apis/custom.metrics.k8s.io/v1beta1” audit-ID=“4a2e6a4b-d1ef-4da0-a8c0-4e84c27615ce” I0602 00:10:39.074973 1 panic.go:965] “HTTP” verb=“GET” URI=“/apis/custom.metrics.k8s.io/v1beta1” latency=“11.675588ms” userAgent=“Go-http-client/2.0” audit-ID=“283e653f-f7e2-482a-b410-01b2a72664a2” srcIP=“10.254.1.1:51580” resp=200 E0602 00:10:39.074992 1 wrap.go:54] timeout or abort while handling: method=GET URI=“/apis/custom.metrics.k8s.io/v1beta1” audit-ID=“283e653f-f7e2-482a-b410-01b2a72664a2” I0602 00:10:39.075137 1 panic.go:965] “HTTP” verb=“GET” URI=“/apis/custom.metrics.k8s.io/v1beta1” latency=“11.828874ms” userAgent=“Go-http-client/2.0” audit-ID=“0f98e845-f456-4f57-9563-ed3e913d86fd” srcIP=“10.254.1.1:51580” resp=200 E0602 00:10:39.075166 1 wrap.go:54] timeout or abort while handling: method=GET URI=“/apis/custom.metrics.k8s.io/v1beta1” audit-ID=“0f98e845-f456-4f57-9563-ed3e913d86fd” E0602 00:10:39.075202 1 writers.go:117] apiserver was unable to write a JSON response: http: Handler timeout E0602 00:10:39.076366 1 writers.go:130] apiserver was unable to write a fallback JSON response: http2: stream closed I0602 00:10:39.076592 1 panic.go:965] “HTTP” verb=“GET” URI=“/apis/custom.metrics.k8s.io/v1beta1” latency=“11.676924ms” userAgent=“Go-http-client/2.0” audit-ID=“0cd76a97-36a0-483a-ba67-86e9f246930c” srcIP=“10.254.1.1:51580” resp=200 E0602 00:10:39.076633 1 wrap.go:54] timeout or abort while handling: method=GET URI=“/apis/custom.metrics.k8s.io/v1beta1” audit-ID=“0cd76a97-36a0-483a-ba67-86e9f246930c” E0602 00:10:39.076673 1 writers.go:117] apiserver was unable to write a JSON response: http: Handler timeout E0602 00:10:39.082087 1 writers.go:117] apiserver was unable to write a JSON response: http: Handler timeout E0602 00:10:39.084555 1 status.go:71] apiserver received an error that is not an metav1.Status: &errors.errorString{s:“http: Handler timeout”}: http: Handler timeout E0602 00:10:39.085661 1 writers.go:130] apiserver was unable to write a fallback JSON response: http: Handler timeout I0602 00:10:39.085962 1 panic.go:965] “HTTP” verb=“GET” URI=“/apis/custom.metrics.k8s.io/v1beta1” latency=“22.647887ms” userAgent=“Go-http-client/2.0” audit-ID=“25cda6c8-d26f-4513-afbd-e78e40a474c2” srcIP=“10.254.1.1:51580” resp=200 E0602 00:10:39.085986 1 wrap.go:54] timeout or abort while handling: method=GET URI=“/apis/custom.metrics.k8s.io/v1beta1” audit-ID=“25cda6c8-d26f-4513-afbd-e78e40a474c2” E0602 00:10:39.085991 1 writers.go:117] apiserver was unable to write a JSON response: http: Handler timeout E0602 00:10:39.087391 1 timeout.go:135] post-timeout activity - time-elapsed: 12.495042ms, GET “/apis/custom.metrics.k8s.io/v1beta1” result: <nil> E0602 00:10:39.089336 1 status.go:71] apiserver received an error that is not an metav1.Status: &errors.errorString{s:“http: Handler timeout”}: http: Handler timeout E0602 00:10:39.090424 1 status.go:71] apiserver received an error that is not an metav1.Status: &errors.errorString{s:“http: Handler timeout”}: http: Handler timeout E0602 00:10:39.091687 1 timeout.go:135] post-timeout activity - time-elapsed: 16.498247ms, GET “/apis/custom.metrics.k8s.io/v1beta1” result: <nil> E0602 00:10:39.093678 1 status.go:71] apiserver received an error that is not an metav1.Status: &errors.errorString{s:“http: Handler timeout”}: http: Handler timeout E0602 00:10:39.095855 1 writers.go:130] apiserver was unable to write a fallback JSON response: http: Handler timeout E0602 00:10:39.096944 1 writers.go:130] apiserver was unable to write a fallback JSON response: http: Handler timeout E0602 00:10:39.099086 1 writers.go:130] apiserver was unable to write a fallback JSON response: http: Handler timeout E0602 00:10:39.100362 1 timeout.go:135] post-timeout activity - time-elapsed: 23.701592ms, GET “/apis/custom.metrics.k8s.io/v1beta1” result: <nil> E0602 00:10:39.101407 1 timeout.go:135] post-timeout activity - time-elapsed: 26.394414ms, GET “/apis/custom.metrics.k8s.io/v1beta1” result: <nil> E0602 00:10:39.102476 1 timeout.go:135] post-timeout activity - time-elapsed: 16.47346ms, GET “/apis/custom.metrics.k8s.io/v1beta1” result: <nil> I0602 00:10:40.817469 1 httplog.go:104] “HTTP” verb=“GET” URI=“/apis/custom.metrics.k8s.io/v1beta1?timeout=32s” latency=“20.563964ms” userAgent=“kube-controller-manager/v1.21.8+ee73ea2 (linux/amd64) kubernetes/f7310cc/system:serviceaccount:kube-system:namespace-controller” audit-ID=“e3baa381-91d4-439c-8d82-a99d88a1df8c” srcIP=“10.254.0.1:41644” resp=200 I0602 00:10:41.268466 1 httplog.go:104] “HTTP” verb=“GET” URI=“/apis/custom.metrics.k8s.io/v1beta1/namespaces/master-cd/pods/%2A/spring_cloud_stream_binder_kafka_offset_Rollover?labelSelector=app%3Dcustomerbill-acbr%2Capp.kubernetes.io%2Finstance%3Dcustomerbill-appliedcustomerbillingrate” latency=“38.893951ms” userAgent=“kube-controller-manager/v1.21.8+ee73ea2 (linux/amd64) kubernetes/f7310cc/system:serviceaccount:kube-system:horizontal-pod-autoscaler” audit-ID=“f9e0fcd8-ddf2-4acc-b302-18d6e943c6d2” srcIP=“10.254.0.1:41644” resp=404 I0602 00:10:41.321660 1 httplog.go:104] “HTTP” verb=“GET” URI=“/apis/custom.metrics.k8s.io/v1beta1/namespaces/master-cd/pods/%2A/Latency_CycleRollOver_seconds?labelSelector=app%3Dcustomerbill-acbr%2Capp.kubernetes.io%2Finstance%3Dcustomerbill-appliedcustomerbillingrate” latency=“40.062263ms” userAgent=“kube-controller-manager/v1.21.8+ee73ea2 (linux/amd64) kubernetes/f7310cc/system:serviceaccount:kube-system:horizontal-pod-autoscaler” audit-ID=“a1cb6b73-5469-44d2-86d1-0ee37dc94e69” srcIP=“10.254.0.1:41644” resp=404 I0602 00:10:42.236036 1 httplog.go:104] “HTTP” verb=“GET” URI=“/apis/custom.metrics.k8s.io/v1beta1?timeout=32s” latency=“22.410863ms” userAgent=“cluster-policy-controller/v0.0.0 (linux/amd64) kubernetes/$Format/system:serviceaccount:openshift-infra:resourcequota-controller” audit-ID=“b70a86dd-eacd-46af-865e-78f35d09841e” srcIP=“10.254.1.1:52016” resp=200 I0602 00:10:42.667459 1 httplog.go:104] “HTTP” verb=“GET” URI=“/apis/custom.metrics.k8s.io/v1beta1/namespaces/rtb-eu-mexico-cd3/pods/%2A/spring_cloud_stream_binder_kafka_offset_Rollover?labelSelector=app%3Dcustomerbill-acbr%2Capp.kubernetes.io%2Finstance%3Dcustomerbill-appliedcustomerbillingrate” latency=“30.923405ms” userAgent=“kube-controller-manager/v1.21.8+ee73ea2 (linux/amd64) kubernetes/f7310cc/system:serviceaccount:kube-system:horizontal-pod-autoscaler” audit-ID=“f5aba336-7b1d-4306-85b2-a3c98a7ff890” srcIP=“10.254.0.1:41644” resp=404 I0602 00:10:42.709278 1 httplog.go:104] “HTTP” verb=“GET” URI=“/apis/custom.metrics.k8s.io/v1beta1/namespaces/rtb-eu-mexico-cd3/pods/%2A/Latency_CycleRollOver_seconds?labelSelector=app%3Dcustomerbill-acbr%2Capp.kubernetes.io%2Finstance%3Dcustomerbill-appliedcustomerbillingrate” latency=“38.221175ms” userAgent=“kube-controller-manager/v1.21.8+ee73ea2 (linux/amd64) kubernetes/f7310cc/system:serviceaccount:kube-system:horizontal-pod-autoscaler” audit-ID=“6d3abd85-815b-45af-9080-ca768c726440” srcIP=“10.254.0.1:41644” resp=404 I0602 00:10:45.403819 1 httplog.go:104] “HTTP” verb=“GET” URI=“/healthz” latency=“649.027�s” userAgent=“kube-probe/1.21” audit-ID=“8ed9dd10-05ad-476e-b13d-3cb309888042” srcIP=“10.254.37.1:42658” resp=200 I0602 00:10:45.404423 1 httplog.go:104] “HTTP” verb=“GET” URI=“/healthz” latency=“114.015�s” userAgent=“kube-probe/1.21” audit-ID=“8b1e5600-63fc-4c33-b353-44d0ba13e7d0” srcIP=“10.254.37.1:42656” resp=200 I0602 00:10:46.470888 1 httplog.go:104] “HTTP” verb=“GET” URI=“/openapi/v2” latency=“4.046499ms” userAgent=“” audit-ID=“4fde3621-6b22-4cdb-a673-eb8d91df1c29” srcIP=“10.254.0.1:41644” resp=304 I0602 00:10:46.473486 1 httplog.go:104] “HTTP” verb=“GET” URI=“/openapi/v2” latency=“293.028�s” userAgent=“” audit-ID=“78d36042-d770-416a-a6a6-44b1ff3bfcb6” srcIP=“10.254.2.1:38716” resp=304 I0602 00:10:46.474318 1 httplog.go:104] “HTTP” verb=“GET” URI=“/openapi/v2” latency=“267.16�s” userAgent=“” audit-ID=“a77d7bf1-db19-44b4-b5b3-9b25263e06b0” srcIP=“10.254.1.1:52016” resp=304 I0602 00:10:47.050865 1 httplog.go:104] “HTTP” verb=“GET” URI=“/apis/custom.metrics.k8s.io/v1beta1?timeout=32s” latency=“19.743576ms” userAgent=“cluster-policy-controller/v0.0.0 (linux/amd64) kubernetes/$Format/system:serviceaccount:openshift-infra:resourcequota-controller” audit-ID=“ed12733c-6927-4efc-8488-7d8d3b4ecf8e” srcIP=“10.254.1.1:52016” resp=200 I0602 00:10:47.571096 1 httplog.go:104] “HTTP” verb=“GET” URI=“/apis/custom.metrics.k8s.io/v1beta1?timeout=32s” latency=“18.400355ms” userAgent=“kube-controller-manager/v1.21.8+ee73ea2 (linux/amd64) kubernetes/f7310cc/system:serviceaccount:kube-system:namespace-controller” audit-ID=“f7ae71cd-769a-43c7-a539-6394a4994af9” srcIP=“10.254.0.1:41644” resp=200 E0602 00:10:48.087168 1 writers.go:117] apiserver was unable to write a JSON response: http2: stream closed E0602 00:10:48.087521 1 status.go:71] apiserver received an error that is not an metav1.Status: &errors.errorString{s:“http2: stream closed”}: http2: stream closed I0602 00:10:48.087227 1 panic.go:965] “HTTP” verb=“GET” URI=“/apis/custom.metrics.k8s.io/v1beta1” latency=“34.856573ms” userAgent=“Go-http-client/2.0” audit-ID=“51c28451-f700-46c3-9acf-760360f85929” srcIP=“10.254.0.1:41636” resp=200 E0602 00:10:48.087570 1 wrap.go:54] timeout or abort while handling: method=GET URI=“/apis/custom.metrics.k8s.io/v1beta1” audit-ID=“51c28451-f700-46c3-9acf-760360f85929” E0602 00:10:48.089399 1 writers.go:130] apiserver was unable to write a fallback JSON response: http2: stream closed I0602 00:10:48.090544 1 panic.go:965] “HTTP” verb=“GET” URI=“/apis/custom.metrics.k8s.io/v1beta1” latency=“38.178148ms” userAgent=“Go-http-client/2.0” audit-ID=“52b5d8e9-8f5f-4c59-96ae-60b842f32806” srcIP=“10.254.0.1:41636” resp=200 E0602 00:10:48.090589 1 wrap.go:54] timeout or abort while handling: method=GET URI=“/apis/custom.metrics.k8s.io/v1beta1” audit-ID=“52b5d8e9-8f5f-4c59-96ae-60b842f32806” E0602 00:10:48.090685 1 timeout.go:135] post-timeout activity - time-elapsed: 3.414355ms, GET “/apis/custom.metrics.k8s.io/v1beta1” result: <nil> E0602 00:10:48.092758 1 writers.go:117] apiserver was unable to write a JSON response: http: Handler timeout E0602 00:10:48.094491 1 status.go:71] apiserver received an error that is not an metav1.Status: &errors.errorString{s:“http: Handler timeout”}: http: Handler timeout E0602 00:10:48.181403 1 writers.go:130] apiserver was unable to write a fallback JSON response: http: Handler timeout
Please re-open the issue
@benjaminhuo @daniel-habib i had the same error as Prometheus Adapter chart was creating default rules. You can avoid that by using this chart configuration :
Here is my configuration :
With this only configuration that gets created is :
The same problem: K8S (v1.26.3), helm, prometheus, prometheus-adapter. Metric is present in Prometheus, Adapter is running, showing external metric, but not value. Logs: I1005 07:54:13.175138 1 httplog.go:132] “HTTP” verb=“LIST” URI=“/apis/external.metrics.k8s.io/v1beta1/namespaces/default/kafka_topic_partition_current_offset” latency=“3.342849ms” userAgent=“kube-controller-manager/v1.26.3 (linux/amd64) kubernetes/f18584a/system:serviceaccount:kube-system:horizontal-pod-autoscaler” audit-ID=“4e5d5ac2-0411-4a4d-aab4-108d56119aa3” srcIP=“10.XX.XX.128:10332” resp=404 … 1005 07:54:19.321095 1 writers.go:122] apiserver was unable to write a JSON response: http2: stream closed E1005 07:54:19.321115 1 status.go:71] apiserver received an error that is not an metav1.Status: &errors.errorString{s:“http2: stream closed”}: http2: stream closed I1005 07:54:19.321209 1 panic.go:884] “HTTP” verb=“GET” URI=“/apis/custom.metrics.k8s.io/v1beta1” latency=“11.018902ms” userAgent=“Go-http-client/2.0” audit-ID=“65d37eb7-0d5d-4aff-865d-adcc5349c9b4” srcIP=“10.XX.XX.128:5200” resp=200 E1005 07:54:19.321233 1 wrap.go:54] timeout or abort while handling: method=GET URI=“/apis/custom.metrics.k8s.io/v1beta1” audit-ID=“65d37eb7-0d5d-4aff-865d-adcc5349c9b4” E1005 07:54:19.321509 1 writers.go:122] apiserver was unable to write a JSON response: http2: stream closed
Running v0.8.3 and I bumped into this issue too
Still happening on version 0.10.0 with K8s api-server 1.23.5
same stuff here, DigitalOcean managed k8s 1.23, prometheus adapter version v0.10.0
@brancz @DirectXMan12 @daniel-habib Sorry for the late response. I ran some tests using kube-prometheus: Tests are done in k8s v1.16.7, same problem in k8s v1.17
monitoring, even with custom metrics enabled(import ‘kube-prometheus/kube-prometheus-custom-metrics.libsonnet’), there is no panic and no error likeapiserver was unable to write a JSON response: http2: stream closed.examples/kustomize.jsonnetwithout enabling custom metrics, everything is fine. No panic and no error logsapiserver was unable to write a JSON response: http2: stream closedexistsSo for me it seems that this is related to prometheus adapter custom metrics functionality and namespace. I am wondering if there is something special with the default
monitoringnamespace?@daniel-habib did you deploy prometheus adapter in a different namespace instead of the default
monitoringnamespace?I am seeing this issue in prometheus adapter v0.8.4 with Kubernetes API server 1.20.
@s-urbaniak We also had the same issue in
v0.8.2on K8S 1.19, and after seing this ticket, we updated tov0.8.3but we still have the issue. Here is a stack trace from the pod logs :Click to expand logs
It would be nice to reopen the issue if possible.
Note : I do not know if it is relevant but we installed it with kube-prometheus
release-0.7and cutomized the prometheus-adapter to point tov0.8.3with jsonnet.@stafot thank you! yes, it seems that this is the same issue then and should be fixed (famous last words) in the next bump of the api machinery dependencies.
hello, sorry but same error on 0.9.3 with Kubernetes 1.21 and 1.22
At pod restart, there are no errors and pod CPU util is fine, but after a few minutes errors start again and pod starts routinely CPU spiking.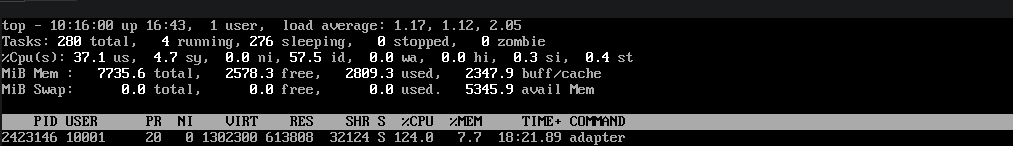
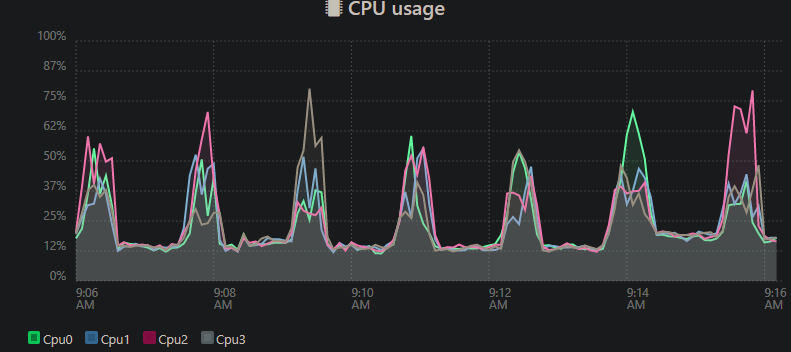 These spikes are entirely attributed to the adapter. Is anyone else seeing this behavior?
Still happening on version 0.10.0 with Azure AKS 1.24.6 Kubernetes version.
As I mentioned multiple times in the past, this issue will remain close as the original issue (panic) was fixed. However if anyone is interested in having the spammy logs being investigated feel free to open another one. But, I don’t think we have the resources to investigate it today.
We are experiencing this error as well in Eks 1.21 + prometheus-adapter:v0.9.1. Also, we have to allocate huge amount of memory (4G in our Production env) for each prometheus_adapter pod to avoid OOM. Not sure if this error has anything to do with that.
Same. This is on OVH managed K8S.
Still happening on v0.10.0 (Helm chart v4.2.0) w/ kubeadm-managed cluster v1.24.15
The solution proposed in here does remove the error from logs, but
kubectl top nocommand still not work witherror: Metrics API not availableerrorany update?
Still happening
If you are seeing this in your logs and your prometheus-adapter pod is in a CrashLoopBackOff then you probably need to increase the amount of memory that prometheus-adapter has allocated. Out of the box the helm chart does not specify enough to handle the default ruleset it ships with.
The original issue mentioned a panic which was fixed by https://github.com/kubernetes/kubernetes/pull/94589 and then vendored in https://github.com/kubernetes-sigs/prometheus-adapter/pull/352.
We investigated the spammy logs in the past but haven’t been able to exactly pinpoint where the issue is coming from. I summed up the status of the investigation in https://github.com/kubernetes-sigs/prometheus-adapter/issues/292#issuecomment-767444375.
The panic doesn’t happen anymore so yes it is. That said the logs are still present but so far I haven’t seen any disruption coming from them nor I have been reported any. So I am pretty confident to say that it is pretty harmless.
cc @s-urbaniak
/cc @DirectXMan12 @brancz I have the exact same problem (
1 runtime.go:76] Observed a panic: runtime error: invalid memory address or nil pointer dereference goroutine 698 [running]:),while trying to deployprometheus-adapterinkops. I used the manifests fromkube-prometheus. Tried to deploy it inprometheusandkube-systemnamespaces with no success. Previously had the same setup on EKS and worked as expected. A main difference is that on eks usedmonitoringnamespace. Any ideas on how i could debug this?I’m running Kubernetes
1.18.3and was brought here by the same issue. Your fix @shardulsrivastava works wonders.Thank you!