kubernetes: HPA doesn't scale down to minReplicas even though metric is under target
What happened:
HPA scales to Spec.MaxReplicas even though metric is always under target.
Here’s the HPA in YAML:
apiVersion: autoscaling/v1
kind: HorizontalPodAutoscaler
metadata:
  annotations:
    autoscaling.alpha.kubernetes.io/conditions: '[{"type":"AbleToScale","status":"True","lastTransitionTime":"2019-06-06T10:46:13Z","reason":"ReadyForNewScale","message":"recommended
      size matches current size"},{"type":"ScalingActive","status":"True","lastTransitionTime":"2019-06-06T10:46:13Z","reason":"ValidMetricFound","message":"the
      HPA was able to successfully calculate a replica count from cpu resource utilization
      (percentage of request)"},{"type":"ScalingLimited","status":"True","lastTransitionTime":"2019-06-06T10:46:13Z","reason":"TooManyReplicas","message":"the
      desired replica count is more than the maximum replica count"}]'
    autoscaling.alpha.kubernetes.io/current-metrics: '[{"type":"Resource","resource":{"name":"cpu","currentAverageUtilization":0,"currentAverageValue":"9m"}}]'
  creationTimestamp: "2019-06-06T10:45:58Z"
  name: my-app-1
  namespace: default
  resourceVersion: "55041251"
  selfLink: /apis/autoscaling/v1/namespaces/default/horizontalpodautoscalers/my-app-1
  uid: 44fedc1a-8848-11e9-8465-025acf90d81e
spec:
  maxReplicas: 4
  minReplicas: 2
  scaleTargetRef:
    apiVersion: extensions/v1beta1
    kind: Deployment
    name: my-app-1
  targetCPUUtilizationPercentage: 40
status:
  currentCPUUtilizationPercentage: 0
  currentReplicas: 4
  desiredReplicas: 4
And here’s a description output:
$ kubectl describe hpa my-app-1
  Name:                                                  my-app-1
  Namespace:                                             default
  Labels:                                                <none>
  Annotations:                                           <none>
  CreationTimestamp:                                     Thu, 06 Jun 2019 12:45:58 +0200
  Reference:                                             Deployment/my-app-1
  Metrics:                                               ( current / target )
    resource cpu on pods  (as a percentage of request):  0% (9m) / 40%
  Min replicas:                                          2
  Max replicas:                                          4
  Deployment pods:                                       4 current / 4 desired
  Conditions:
    Type            Status  Reason            Message
    ----            ------  ------            -------
    AbleToScale     True    ReadyForNewScale  recommended size matches current size
    ScalingActive   True    ValidMetricFound  the HPA was able to successfully calculate a replica count from cpu resource utilization (percentage of request)
    ScalingLimited  True    TooManyReplicas   the desired replica count is more than the maximum replica count
  Events:           <none>
What you expected to happen:
HPA only scales up when metric is above target and scales down when under until Spec.MinReplicas is reached.
How to reproduce it (as minimally and precisely as possible):
I’m not sure. We have 9 HPAs and only one has this problem. I can’t see anything unique about this HPA when comparing to the others. If I delete and recreate the HPA using Helm, same problem. Also if I recreate the HPA using kubectl autoscale Deployment/my-app-1 --min=2 --max=4 --cpu-percent=40 same problem.
Environment:
- Kubernetes version (use
kubectl version):v1.12.6-eks-d69f1b - Cloud provider or hardware configuration: AWS EKS
- OS (e.g:
cat /etc/os-release): EKS AMI releasev20190327 - Kernel (e.g.
uname -a):4.14.104-95.84.amzn2.x86_64 - Network plugin and version (if this is a network-related bug): AWS CNI
- Metrics-server version:
0.3.2
About this issue
- Original URL
- State: closed
- Created 5 years ago
- Reactions: 87
- Comments: 113 (5 by maintainers)
Commits related to this issue
- skipper-ingress: update `selector.matchLabels` `skipper-ingress` HPA, although targets deployment by name, uses its selector labels to get metrics https://github.com/kubernetes/kubernetes/issues/7876... — committed to zalando-incubator/kubernetes-on-aws by AlexanderYastrebov 2 years ago
- skipper-ingress: update `selector.matchLabels` `skipper-ingress` HPA, although targets deployment by name, uses its selector labels to get metrics https://github.com/kubernetes/kubernetes/issues/7876... — committed to zalando-incubator/kubernetes-on-aws by AlexanderYastrebov 2 years ago
- skipper-ingress: update `selector.matchLabels` `skipper-ingress` HPA, although targets deployment by name, uses its selector labels to get metrics https://github.com/kubernetes/kubernetes/issues/7876... — committed to zalando-incubator/kubernetes-on-aws by AlexanderYastrebov 2 years ago
- skipper-ingress: update `selector.matchLabels` `skipper-ingress` HPA, although targets deployment by name, uses its selector labels to get metrics https://github.com/kubernetes/kubernetes/issues/7876... — committed to zalando-incubator/kubernetes-on-aws by AlexanderYastrebov 2 years ago
- skipper-ingress: update `selector.matchLabels` `skipper-ingress` HPA, although targets deployment by name, uses its selector labels to get metrics https://github.com/kubernetes/kubernetes/issues/7876... — committed to zalando-incubator/kubernetes-on-aws by AlexanderYastrebov 2 years ago
- skipper-ingress: update `selector.matchLabels` `skipper-ingress` HPA, although targets deployment by name, uses its selector labels to get metrics https://github.com/kubernetes/kubernetes/issues/7876... — committed to zalando-incubator/kubernetes-on-aws by AlexanderYastrebov 2 years ago
Ok, i think i finally know whats going on, it seems that many people are facing this issue, and since down scaling is important for our model i decided to run some tests, turns out the problem is in the calculation done by the HorizontalPodAutoscaler controller: desiredReplicas = ceil[currentReplicas * ( currentMetricValue / desiredMetricValue )]
Ansatz: this equation when scaling down works when the change in utilization due to load difference is big, usually with cpu ( e.g. 100m - 500m <=> 20% - 100%), but it fails when the change in utilization is small, usually with memory (e.g. 160Mi - 200Mi <=> 80% - 100%)
Theoretical example: lets say we have a situation where we have a deployment with resources.requests.memory is set to 200Mi, and HPA averageUtilization for memory resource is set to 100%(=200Mi). because of high memory usage pods were scaled up from 1 to 4, after scaling the memory usage dropped down from 200Mi to 160Mi, now we have 4 pods with avg. of 160Mi, HPA is showing: 80% / 100% since we demanded scale up on 100% usage of requested 200Mi, current usage = 160Mi -> 160/200 = 0.8 or 80%. now the HPA will run the equation above and see what to do, so: desiredReplicas = ceil[4 * ( 80 / 100 )] = ceil[3.2] = 4 and there are already 4 pods, so it will not act even though the metric is under avg. of targets.
Empirical example: Setup: we have the namespace “1” (just for ease of typing), in it there are 3 deployments 1 - rails pod 2 - redis pod 3 - postgresql pod testing is done on rails pod where it can be scaled up from 1 to 5 pods when memory usage is high.
in rails deployment yml file:
rails HPA
Testing: first we have the setup with the rails dep, without the HPA, as you can see its idle at 4m & 158Mi, which means when we deploy the HPA with averageUtilization: 50 it would start scaling up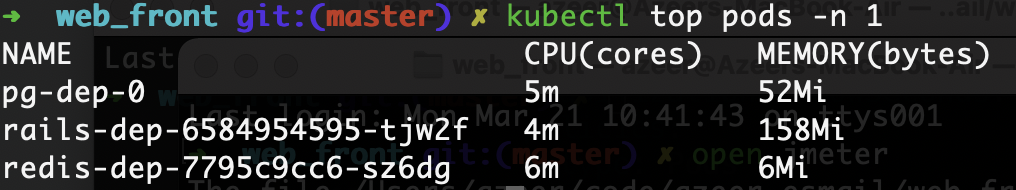
deploying HPA
after few minutes is scales up to 5 pods (memory still above 50% but it reaches the max limit of 5 pods)
------------Mathematical reasoning for those who are interested, you can skip and use the equation------------ now lets calculate what is the limit needed for HPA to scale it down and re create the HPA with different limits to test the theory, to do that we need express the desiredMetricValue in terms of the other values by re arranging: desiredReplicas = ceil[currentReplicas * ( currentMetricValue / desiredMetricValue )] or: desiredReplicas = ceil[(currentReplicas * currentMetricValue) / desiredMetricValue ] its possible to replace the RHS with: (currentReplicas * currentMetricValue) / (desiredMetricValue - epsilon) (drop ceil function and subtract a quantity from denominator) if the following conditions are satisfied:
in simple words the replacement of ceil function is to subtract a number (epsilon) from the denominator so that the division yields an integer and the difference between that integer, and result without subtracting epsilon in less than 1. so now we have: desiredReplicas = (currentReplicas * currentMetricValue) / (desiredMetricValue - epsilon) rearranging: desiredMetricValue = [(currentReplicas * currentMetricValue) / desiredReplicas] + epsilon now if we add the constraint that all these variables are positive integers (which they are in practice) then to ensure that RHS is always an integer (because the LHS desiredMetricValue is an integer): epsilon = ceil[(currentReplicas * currentMetricValue) / desiredReplicas] - (currentReplicas * currentMetricValue) / desiredReplicas for example assume the quantity: (currentReplicas * currentMetricValue) / desiredReplicas = 4.4, to ensure the RHS is integer epsilon must be: ceil(4.4) - 4.4 = 5 - 4.4 = 0.6, => 4.4 + 0.6 = 5 which is an integer it actually can also be 1.6, 2.6, 3.6 etc… which can be added to the epsilon equation (+ k) where k is 0, or positive integer. but for simplicity let just assume it’s 0 and omit it. then substituting for epsilon we get:
desiredMetricValue = ceil[(currentReplicas * currentMetricValue) / desiredReplicas]
so we use this equation with what we have now to scale down: desiredMetricValue = ceil[(5 * 84) / 4] = 105
this means we need to set HPA averageUtilization to 105 (105%) in order to scale down to 4, i will set it to 104 first, wait and make sure it doesn’t scale down and then to 106 and check if it does.
desiredMetricValue = ceil[(5 * 84) / 4] = 105
this means we need to set HPA averageUtilization to 105 (105%) in order to scale down to 4, i will set it to 104 first, wait and make sure it doesn’t scale down and then to 106 and check if it does.
 after 6 min still 5 replicas

averageUtilization: 104apply HPA changes:now change averageUtilization to 106 and apply and in less than a minute it scaled down to 4!

averageUtilization: 106one more try to drive the point home, scale from 4 to 3 calc: ceil[(4 * 84) / 3] = 112 exact limit test: after 6 min still 4 replicas

averageUtilization: 111averageUtilization: 112conclusion: this algorithm is suitable for scaling up even if the change is small as it ceils the calculated quantity, so it scales up on exact limit of upper bound, but when scaling down it also ceils, so the difference has to be big enough in order to get a smaller number of replicas after ceiling. it’s worth mentioning also, if this wasn’t the case that a big difference is needed to scale down with current algorithm, the HPA would have a flapping
problem: utilization overload -> scales up -> utilization drop -> scales down -> utilization overload -> scales up -> ad infinitum worst case scenario is when scaling down from 2 -> 1 pod, the the desiredMetricValue should be double the currentMetricValue — desiredMetricValue = 2 * currentMetricValue for it to scale down (50% / 100%)
solution: i tweaked around with variables to see if there is a work around, and there is but its bound to idle memory utilization and the amount of increase it takes to scale up, like if its set in a way that it starts with 49% / 100% (less than 50%) at idle then it will scale down when there is no load, the catch is that the amount of increase it needs to scale up to 2 pods is larger than double, which is not and ideal solution. an algorithmic solution could be by introducing a new variable scaleDownThreshold defined by the user as follows:
for now its better to stick to CPU metric and make sure currentMetricValue at idle is at most half desiredMetricValue.
currentMetricValue * 2 =< desiredMetricValue
My issue was this. I was trying to track it down for like 6 weeks, read this and many other posts but completely missed the point that it’s the selectors of the scaleTargetRef that you need to make sure are only selecting the pods in the deployment. Deployment, ReplicaSets, etc… will apparently work perfectly fine with selector that is selecting pods from other deployments, but fail hard when you attach an HPA. This is more than a little frustrating…
In our case a developer had a dozen different deployments all with the same label
app: myapp(let’s say). Then usedselector: matchLabels: app: myappSo even though the deployment only had 4 pods, the HPA was calculating replicas using over 50 pods… You will not see this in describe, or get, or k8s logs… they all report from the deployment numbers BUT the replica count code is using the targets selector to build the collection of metrics 🤦 https://github.com/kubernetes/kubernetes/blob/master/pkg/controller/podautoscaler/horizontal.go#L574 (clarification, the scale object returned there is then used to find the selector and calculates replicas using that selector https://github.com/kubernetes/kubernetes/blob/master/pkg/controller/podautoscaler/horizontal.go#L258)
So is this our “bug”, should this be addressed? Or merely better docs… this is really hard to describe… took me a couple attempts with the dev team that caused it and my own core k8s team before they got it.
I’m having the exact same issue as you @max-rocket-internet, also running on EKS with their latest version available to date. This is frustrating 😦
Having the same issue on 1.15.9(on aws via kops), I tried all hpa v1, v2beta1 and v2beta2, and both cpu utilization and custom metrics(like requests per second) via prometheus adapter, hpa always scale up and never scales down even metric is much smaller than target value.
I’ve had this issue for months and this ended up being what fixed it. I had three deployments in the same cluster which had the same pod labels and
.spec.selectorfields. I added a unique label/selector field to each deployment (note: I needed to delete and recreate the deployment since the selector field is immutable). After that the HPA started behaving normally.Same issue here. Running k8s 1.19.13 on GKE. Deployment scales up but won’t scale down.
This issue might be related to https://github.com/kubernetes/kubernetes/issues/85506, where it seems pending pods will prevent an HPA from scaling down.
For those who are seeing this issue on GKE, here’s the google bugtracker for the issue: https://issuetracker.google.com/issues/204415098
I have the same issue but none of the fixes here are working for me. I’m running 1.16 on digitalocean’s DOKS managed k8s.
My CPU util target is 80%.
kubectl describe hpaconstantly reports below target.HPA always maxes out.
I am experiencing the same issue (v1.14.6).
In my scenario, I had an auto-scale event that brought the replica number to 2. After load has stopped, the 2 pods were utilizing ~30% CPU (targetCPUUtilizationPercentage=50).
HPA never kicked in and scaled it down, so I started experimenting (waiting several minutes after each step):
CPU utilization kept around 30% all along.
To me, this looks like the HPA is malfunctioning. I thought this might have been fixed on a later release, but I see this issue is still open and active so I guess it wasn’t.
@itninja-hue
Scale Down stabilization is 5 minutes by default and you can change it with that flag.
--horizontal-pod-autoscaler-downscale-stabilizationsee more details here.
Yeah, this issue needs to be reopened as this is a blocker for using memory HPA in Kubernetes.
Seeing this in kubernetes 1.21 when using custom metrics. The metric drops below target and the HPA responds by scaling up.
@liggitt @wojtek-t @pohly @smarterclayton Could anyone of you reopen this issue maybe?
As a temporary workaround I was able to get it scale down by deleting all pods that were not running (pods with state
Terminated,NodeShutdownect). Make sure only pods withRunningstatus are visible when you runkubectl get pods -AThis was a GKE cluster (version: 1.21.5-gke.1302) with preemptible option enabled which cause lot of instances to be in status of
TerminatedorNodeShutdownstatus.Do you use fluxcd ir some continuos deployment?
Make sure that spec.replicas of your deployment.yml no exist.
It can be reproduced with this:
This is definitely a bug and should be fixed! The HPA
scaleTargetRefuses deployment bynameand that should be enough without having to worry about selectors.@max-rocket-internet Try increasing your metrics resolution from the default. I was experienceing similar behavior, I added the flag
--metric-resolution=5s(the default is 60s), and it seems to be behaving in a much more expected manner now.As @SocietyCao said, in my case it appears that the HPA was rapidly scaling up my service, creating a bunch of pods that didn’t have any metrics yet, which in turn caused the HPA to assume the pods were under load. Seems like it can create a feedback loop of sorts.
For us this issue started appearing as soon as we upgraded to GKE 1.21 about a month ago. After some investigation we noticed that we have Pods in
Terminatedand/orNodeShutdownstate more often than when we were on GKE 1.20. Having more such pods is probably (most likely?) related to the Graceful node shutdown feature that went into beta in Kubernetes 1.21 (and thus is enabled by default). Though according to the GKE release notes this should have been enabled on preemptible node pools since GKE 1.20.5-gke.500. However, at least on our GKE 1.20.11-gke.1801 clusters we can confirm (as far as that’s possible) that it doesn’t seem to be enabled there:kube-proxyis not started with theGracefulNodeShutdownfeature gate (while it is the case for GKE 1.21). Now that’s not the way to know if the feature node is enabled in the control plane or not, but it’s the closest you can get to it (as far as we know).Anyway, it indeed seems (in our scenario) that because of the increase in
Status=FailedPods we’re being hit by our HPAs not scaling down properly anymore. Cleaning up the terminated pods makes the HPA scale down again.Since I separated all cronjobs from my app’s helm chart(one release with deployment and one release with cronjobs from the same chart, and they only have different name), hpa started to scale deployment correctly. This is very weired, because pods from deployment and cronjobs have different
componentlabel(web-serverandcronjob).I’m using
EKS 1.17and faced same issue. I tried everything that I saw in this thread. Finally I make it down, by deleting old replicasets (kubectl delete $(kubectl get all | grep replicaset.apps | grep "0 0 0" | cut -d' ' -f 1)), increasingtargetAverageUtilizationfrom80to90hpa.yaml, and what I think make it work, removingreplicas: 1from deployment.ymlEhh, we’ve lost some money in off-peak hours because of not scaling down…
But, I think I’ve found a workaround in the meantime.
It seems that using
autoscaling/v1instead ofautoscaling/v2beta2if you can rely just on CPU usage works correctly: