kubernetes: client-go v0.21 leaking go routines when using SPDYExecutor
When running the following program on the control-plane Node of my K8s cluster, I observe a large amount of goroutines and therefore memory being leaked:
package main

import (
	"bytes"
	"flag"
	"fmt"
	"net/http"
	_ "net/http/pprof"
	"path/filepath"

	corev1 "k8s.io/api/core/v1"
	"k8s.io/client-go/kubernetes"
	"k8s.io/client-go/kubernetes/scheme"
	restclient "k8s.io/client-go/rest"
	"k8s.io/client-go/tools/clientcmd"
	"k8s.io/client-go/tools/remotecommand"
	"k8s.io/client-go/util/homedir"
)

const (
	podNamespace  = "default"
	podName       = "test"
	containerName = "test"
)

func runCommandFromPod(clientset kubernetes.Interface, kubeConfig *restclient.Config, cmd []string) (stdout string, stderr string, err error) {
	request := clientset.CoreV1().RESTClient().Post().
		Namespace(podNamespace).
		Resource("pods").
		Name(podName).
		SubResource("exec").
		Param("container", containerName).
		VersionedParams(&corev1.PodExecOptions{
			Command: cmd,
			Stdin:   false,
			Stdout:  true,
			Stderr:  true,
			TTY:     false,
		}, scheme.ParameterCodec)
	exec, err := remotecommand.NewSPDYExecutor(kubeConfig, "POST", request.URL())
	if err != nil {
		return "", "", err
	}
	var stdoutB, stderrB bytes.Buffer
	if err := exec.Stream(remotecommand.StreamOptions{
		Stdout: &stdoutB,
		Stderr: &stderrB,
	}); err != nil {
		return stdoutB.String(), stderrB.String(), err
	}
	return stdoutB.String(), stderrB.String(), nil
}

func main() {
	var kubeconfig *string
	if home := homedir.HomeDir(); home != "" {
		kubeconfig = flag.String("kubeconfig", filepath.Join(home, ".kube", "config"), "(optional) absolute path to the kubeconfig file")
	} else {
		kubeconfig = flag.String("kubeconfig", "", "absolute path to the kubeconfig file")
	}
	flag.Parse()

	// use the current context in kubeconfig
	config, err := clientcmd.BuildConfigFromFlags("", *kubeconfig)
	if err != nil {
		panic(err.Error())
	}

	// create the clientset
	clientset, err := kubernetes.NewForConfig(config)
	if err != nil {
		panic(err.Error())
	}

	go func() {
		fmt.Println(http.ListenAndServe("localhost:8080", nil))
	}()

	cmd := []string{"true"}
	i := 0
	for {
		fmt.Printf("Running command - %d\n", i)
		_, _, err := runCommandFromPod(clientset, config, cmd)
		if err != nil {
			panic(err.Error())
		}
		i++
	}
}
After a couple minutes of running the program (a couple thousands of exec’s), we get this memory profile:
(pprof) top
Showing nodes accounting for 449.64MB, 97.71% of 460.18MB total
Dropped 42 nodes (cum <= 2.30MB)
Showing top 10 nodes out of 69
      flat  flat%   sum%        cum   cum%
  337.59MB 73.36% 73.36%   417.53MB 90.73%  compress/flate.NewWriter
   77.44MB 16.83% 90.19%    77.44MB 16.83%  compress/flate.(*compressor).initDeflate (inline)
   19.08MB  4.15% 94.33%    19.08MB  4.15%  compress/flate.(*dictDecoder).init (inline)
    6.02MB  1.31% 95.64%    25.10MB  5.46%  compress/flate.NewReaderDict
    4.51MB  0.98% 96.62%     4.51MB  0.98%  compress/flate.(*huffmanEncoder).generate
       2MB  0.44% 97.06%        3MB  0.65%  crypto/x509.parseCertificate
    1.50MB  0.33% 97.38%     2.50MB  0.54%  compress/flate.newHuffmanBitWriter (inline)
       1MB  0.22% 97.60%     2.50MB  0.54%  crypto/tls.(*Conn).readHandshake
    0.50MB  0.11% 97.71%     3.50MB  0.76%  k8s.io/client-go/transport.TLSConfigFor
         0     0% 97.71%     4.51MB  0.98%  compress/flate.(*Writer).Flush
(pprof)
A surprising amount of memory consumed, which tends to show that the SPDY connections are not closed properly. If we look at the goroutines at the same time, we get a lot of these:
goroutine 66487 [chan send]:
github.com/moby/spdystream.(*Connection).shutdown(0xc04e647600, 0x0)
	/Users/abas/go/pkg/mod/github.com/moby/spdystream@v0.2.0/connection.go:743 +0x2b5
created by github.com/moby/spdystream.(*Connection).Close
	/Users/abas/go/pkg/mod/github.com/moby/spdystream@v0.2.0/connection.go:769 +0x135
About a thousand of them to be precise, and the number keeps growing:
curl -sK -v http://localhost:8080/debug/pprof/goroutine?debug=2 | grep "Close" | wc -l
1104
All these goroutines are stuck at https://github.com/moby/spdystream/blob/dbc715126c0e3fa07721879c6d265b2b82c71e5b/connection.go#L743. They are stuck there because:
- some error occurred during connection shutdown
- there was no consumer for this error (client-go calls
Close()and notCloseWait(), in which case the behavior is to wait for 10 minutes for a consumer before dropping the error. In other words one would have to wait 10 minutes for these goroutines to be destroyed and all the memory they use to be released. But during that time window, it is possible for a lot of gouroutines to get stuck, explaining the high memory consumption for the program.
During testing, I added a debug log statement for this error: https://github.com/antoninbas/spdystream/blob/99cf4e950e5d71cdf3e940bfa866bd10313f1862/connection.go#L770. What I got was a lot of “broken tcp pipe” messages, so the underlying TCP connection used by the SPDY streams was closed (prematurely?).
I went further and captured the TCP packets between the test program and the apiserver. What I saw was hundreds of TCP RST packets, which explains the “broken TCP pipe message”. Zooming in on one specific connection, we get:
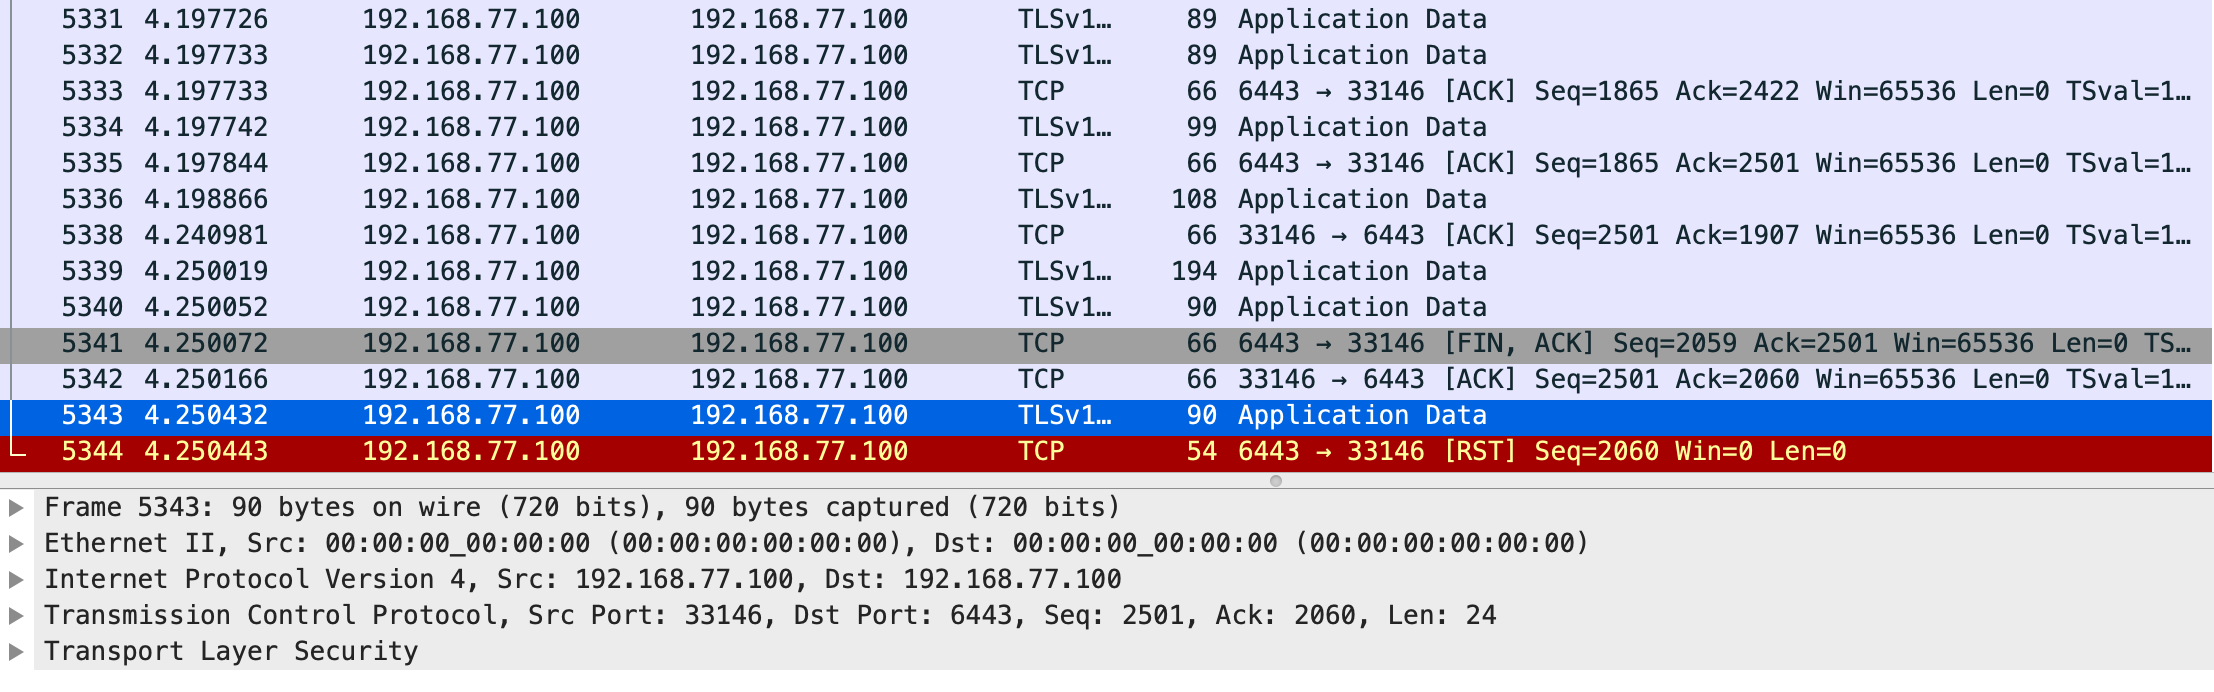
This shows that a FIN-ACK is received from the apiserver (which we ACK!), yet we still try to send data after that, which is why we get a TCP RST and a “broken pipe error”.
A few interesting notes:
- this only happens if I run the test program on one of my K8s Nodes (in this case the control-plane Node where the apiserver is running). It doesn’t happen from a server which is not part of the cluster for some reason.
- this only happens with client-go v0.21. Why? Because spdystream was updated as part of that release: https://github.com/kubernetes/client-go/commit/b8b770f6b787159db35290cdb615f3300147a69d. Before that, the same old version of spdystream was used for years, and it didn’t include this bug fix: https://github.com/moby/spdystream/commit/1d9fc660edd8230d3ea261cda2759b994bb3f455. This looks like a legitimate bug fix, but before it was merged errors during connection closing were dropped instead of causing a goroutine to be spawned.
More info:
- I am using a v1.21.2 K8s cluster created with kubeadm
- The test program is on Github (https://github.com/antoninbas/spdystream-test) if someone wants to work on this issue and reproduce it locally
About this issue
- Original URL
- State: closed
- Created 3 years ago
- Comments: 31 (19 by maintainers)
Hello @aojea:
I tried with versions v0.20.2, v0.21.2 and v0.22.2 of client-go, but my controller is always going to OOMKilled due to this.
@aojea I think #103177 and the addition of
StreamWithContextwill workaround the issue as it will provide a mechanism to force goroutine cleanup for every stream. However, it feels like it is a bandaid and doesn’t address the underlying issue. From the PR description:This is pretty much also what I observe. My test program (see above) just runs the
truecommand on every Pod and yet I see a large number of streams not being cleaned up properly, with the goroutine being leaked. It just shouldn’t happen in the first place, even though letting the client provide aContextwill force an early cleanup (instead of having to wait for 10 minutes). IMO, it’s also concerning that the “location” of the client matters (cluster Node vs out-of-cluster).