kubernetes: [BUG] Windows disk usage getting reported larger than disk size and may prevent GC from running
What happened?
Value reported by crictl.exe imagefsinfo is roughly around ~530 GiB.
{
  "status": {
    "timestamp": "1677171468699023800",
    "fsId": {
      "mountpoint": "C:\\ProgramData\\containerd\\root\\io.containerd.snapshotter.v1.windows"
    },
    "usedBytes": {
      "value": "570024692671"
    },
    "inodesUsed": {
      "value": "0"
    }
  }
}
The volume however is only 511 GB with 91 GB free:
Get-Volume -DriveLetter C

DriveLetter FriendlyName FileSystemType DriveType HealthStatus OperationalStatus SizeRemaining      Size
----------- ------------ -------------- --------- ------------ ----------------- -------------      ----
C           Windows      NTFS           Fixed     Healthy      OK                     90.75 GB 511.51 GB
When checking the snapshotter directory via PowerShell it gives me ~509 GiB which also seems off:
"{0} Bytes" -f ((Get-ChildItem C:\ProgramData\containerd\root\io.containerd.snapshotter.v1.windows\snapshots -Recurse | Measure-Object -Property Length -Sum -ErrorAction Stop).Sum)
546676366719 Bytes
ImageFsStats may calculates the disk usage wrongly on Windows (may because of symlinks?).
It looks like the wrong disk usage calculation prevents the GC from running and deleting unused images. Two of my Windows nodes failed with disks being full although DiskPressure was reported as false. The kubelet logs didn’t show any GC logs.
What did you expect to happen?
The disk usage of Windows nodes should be calculated correctly. DiskPressure=true should be reported when it’s the case. The GC should start deleting unused images when imageGCHighThresholdPercent is reached.
How can we reproduce it (as minimally and precisely as possible)?
- Setup a cluster with a Windows node
- Start many pods on the Windows node with different images to fill up the disk
- Run
crictl.exe imagefsinfoand compare it toGet-Volume -DriveLetter C
Anything else we need to know?
I set the GC settings in my kubelet config:
"imageMinimumGCAge": "2m0s",
"imageGCHighThresholdPercent": 85,
"imageGCLowThresholdPercent": 80,
Kubernetes version
$ kubectl version
Client Version: version.Info{Major:"1", Minor:"26", GitVersion:"v1.26.1", GitCommit:"8f94681cd294aa8cfd3407b8191f6c70214973a4", GitTreeState:"clean", BuildDate:"2023-01-18T15:58:16Z", GoVersion:"go1.19.5", Compiler:"gc", Platform:"windows/amd64"}
Kustomize Version: v4.5.7
Server Version: version.Info{Major:"1", Minor:"25", GitVersion:"v1.25.4", GitCommit:"b969368e201e1f09440892d03007c62e791091f8", GitTreeState:"clean", BuildDate:"2022-12-16T19:44:08Z", GoVersion:"go1.19.3", Compiler:"gc", Platform:"linux/amd64"}
Cloud provider
OS version
# On Windows:
C:\> wmic os get Caption, Version, BuildNumber, OSArchitecture
Microsoft Windows Server 2022 Datacenter, 10.0.20348, 20348, 64-bit
Install tools
Container runtime (CRI) and version (if applicable)
Related plugins (CNI, CSI, …) and versions (if applicable)
/sig windows
About this issue
- Original URL
- State: closed
- Created a year ago
- Comments: 26 (7 by maintainers)
Disclaimer: Sorry about the wall of text 😄
An update on this. I’ve been side tracked a bit, but will investigate more in depth as time permits. In the meantime, some more details on why I think there is a difference between what
Get-Volumeshows and what powershell and other tools show in terms of usage/free space.The short version is: It has to do with the way
windows-layerand WCIFS (Windows Container Isolation File System) are implemented.The longer version:
The context
A
windows-layercan have 3 possible states:sandbox.vhdx, and any changes done by the container is stored in this file.The base layer
This layer holds the initial OS files needed by a container and optionally a
UtilityVMfolder which is used when creating a Hyper-V isolated container. Without going into too much detail, Hyper-V isolated containers work similarly to Kata containers. A VM is started and the actual container is then started inside that VM.This layer is never mounted directly. Before a container can make use of it, a new scratch layer is created with the base layer as a parent. The scratch layer is essentially a writable overlay which stores it’s changes inside that
sandbox.vhdx.Read-only non base layers
These layers are derived from a base layer, and imported whenever we do a
ctr i pullof an image. Imported layers don’t hold asandbox.vhdxand cannot be exported again. Also, these layers cannot be used directly. A new scratch layer needs to be created from a read-only layer (and it’s parents).To generate a new read-only layer, we use the
ctr snapshot commitcommand on an active scratch layer. This will export the scratch layer and import it back on top of itself (at least in containerd). To do this, we leverage the export layer functionality inHCS, which requires that we give it the entire layer chain up to the scratch layer, in descending order as well as the scratch layer.The two step process goes something like this:
tar.gzcontaining any newly added files, changed files, and metadata about files and folders we delete (toombstones.txt).Importing a
windows-layerWhen importing a
windows-layer, we need to provideHCSwith the entire parent layer chain that was used when we exported it and an empty folder that will become the newly imported layer.HCSwill then proceed to take each layer in that chain, one after another, and create reparse points that will point to files in parent “read-only” layers. Note, the base layer files are skipped.Of course, if the next layer removes that file, the reparse point is also removed. This process continues, until we reach the last layer in the chain. Once all parent layers are processed, and reparse points are created, the contents of the
tar.gzare applied over the new layer. This means files/links get added, the metadata is read and any files that were deleted are also deleted from the layer.We now have a new imported layer that holds (potentially) many reparse points to files in other layers, and maybe a few new files, unique to our layer. The reparse points that belong to other layers will appear as Offline if we inspect their attributes. This is because they don’t really exist on the host. More on that bellow.
WCIFS and putting it all together
The Windows Container Isolation File System acts as an overlay. It takes all the layers in the chain, and combines them into one
\\?\Volume{}. The reparse points that pointed nowhere on the host, are magically “hidrated” and can now be accessed. That’s because the references stored in the reparse point, now exist within the context of that virtual volume. We can view them if we mount them on the host via:The
C:\testfolder will hold the files in question.The mystery of the extra disk space
When we use either Windows explorer or
powershellto get the total disk used within a folder, theLengthattribute of each file, reparse points included, will be inspected and added to the total. The reparse points in our case, don’t actually take up any disk space, but they do have a length attribute which mirrors the original file.So the
du.execommand above might actually give a better estimate of actual usage, as it seems to silently ignore not being able toos.Stat()those files to get their attributes.The more “read-only” layers you have, the more pronounced the discrepancy between what
Get-Volumeshows and whatreturns.
How to reproduce
Get a list of layers:
Pick any committed snapshot and create a scratch layer:
Mount the new layer:
Change something small, like add a new file, then unmount:
and commit:
Now, if you go to the actual layer on the host and run:
You will notice that even though you may have added a 1 KB file, a lot more disk space seems to be used. This is because all files added in previous layers have a reparse point present in this new one. But the actual usage of this layer is the “1 KB” file, plus the layered hive files you see in the
Hivesfolder. These should be small though.Final thoughts
I still need to investigate more, but it seems that
crictl.exe imagefsinfoadds the size of the reparse points to the total (not sure, though). If it does, we’ll probably need to change that to get an accurate metric of used space.Will ping back when I find out more.
I also managed to reproduce this by starting
procmonsetting up a filter for the parent layer and simply watching for events. Defender was disabled. So I am not sure what the actual mechanism is here, but more than one thing seems to trigger this, for this particular workload.I am almost convinced that a process container that runs exclusively userspace services will not exhibit this.
Another update.
This does not seem to happen when Hyper-V isolation is used. Which leads me to think that defender may not be the root cause of the issue, but merely a trigger.
The following is just a hypothesis. As I am not really familiar with windows internals at that level, so this is just a guess:
The workload running inside the container we’re using to reproduce this is a web app running inside IIS. From what I remember (it’s been a while since I’ve looked at it), IIS is an
in-kernelweb server implementation.The files we see open from that parent layer that seems to get locked, are held open by
SYSTEMprocess (pid 4). As the container starts and the app loads it’s files, we see more and more files from a parent layer being open. All of them bySYSTEM. If it were WCIFS or HCS doing this, then in all likelihood this would have happened when the container booted, not as the app loaded it’s libraries.Windows server containers share the same kernel as the host. It is possible that as the app loads it’s files, some interactions of defender, may open a handle or access the file in some way when as it’s loaded by IIS/svchost/pid 4.
When the container is killed, the kernel (obviously) remains, because it’s shared with the host. But I think it still holds an open handle to those files for some reason. Sadly, I am not that familiar with how IIS works or with windows internals at this level, but given the fact that this doesn’t repro with Hyper-V isolation enabled, it stands to reason that this may be the root cause.
When using hyper-v isolation, a new partition is created, a VM is spun up with it’s own kernel and a container is started inside of it. We still see the files being open on the host, but this time they are not open by
SYSTEM(pid 4), they are open by avmmemprocess with it’s own PID.When we kill the container, that process exits, the kernel running inside the VM exits and the files are released. On the host, the parent layers are released every time.
It is possible that this behavior would not manifest if the workloads inside the container run exclusively in userspace. Using a HTTP server implementation (or any other kind of workload) that does not run
in-kernelwill probably not trigger this, even without hyper-v isolation.To test this, I updated the
containerd.exebinary to version 1.7.0 and thecontainerd-shim-runhcs-v1.exe(hcsshim) binary to the latest rc tag.I updated
'C:\Program Files\containerd\config.tomlto:I created a new runtime class in k8s:
And used:
In the workload yaml file.
Will keep investigating and add more details as they become available.
I narrowed it down to just:
Will update this bug as more info becomes available.
@gabriel-samfira thanks a lot for the write-up, very interesting!
More important than the size differences of different tools is to me that the disk really gets full. kubelet correctly identifies that but fails to garbage collect images (see https://github.com/kubernetes/kubernetes/issues/116020#issuecomment-1443244191).
It seems like containerd isn’t fully deleting snapshots or keeping wrong records about doing so, like I described in https://github.com/kubernetes/kubernetes/issues/116020#issuecomment-1443575342.
Do you have an idea about that?
Hi @lippertmarkus
Apologies for the delay. I am still investigating, but a few observations so far:
du.exeis not the best tool to compute disk usage on Windows. It may show less disk space being used than what is actually being used.imagefsinfocontainerdapi which is used by ctr.exe.ctr.exe i pull mcr.microsoft.com/windows/nanoserver:ltsc2022will produce a new snapshot and will show up inctr.exe i ls. All layers of that image will show up inctr.exe shapshot ls.crictl.exe pull mcr.microsoft.com/windows/nanoserver:ltsc2022will create a new snapshot.imagefsinfocommand will only show us the size of the images downloaded via the containerd CRI api (through crictl.exe). This value is most likely cached inmetadata.db, not fetched directly from the disk.I am spinning up a k8s cluster and reproducing this. Sorry for the delay.
Digged a bit deeper by increasing the disk usage and looking at the logs. GC did indeed garbage collect:
GC logs:
The
usageandamountToFreein the logs are correct. The logs also tell that images were removed, the disk usage however didn’t get lower, or sometimes only a little bit lower but not to the amount the log says.Consider the following graph on the disk usage %, with the red vertical lines being GC runs according to the logs: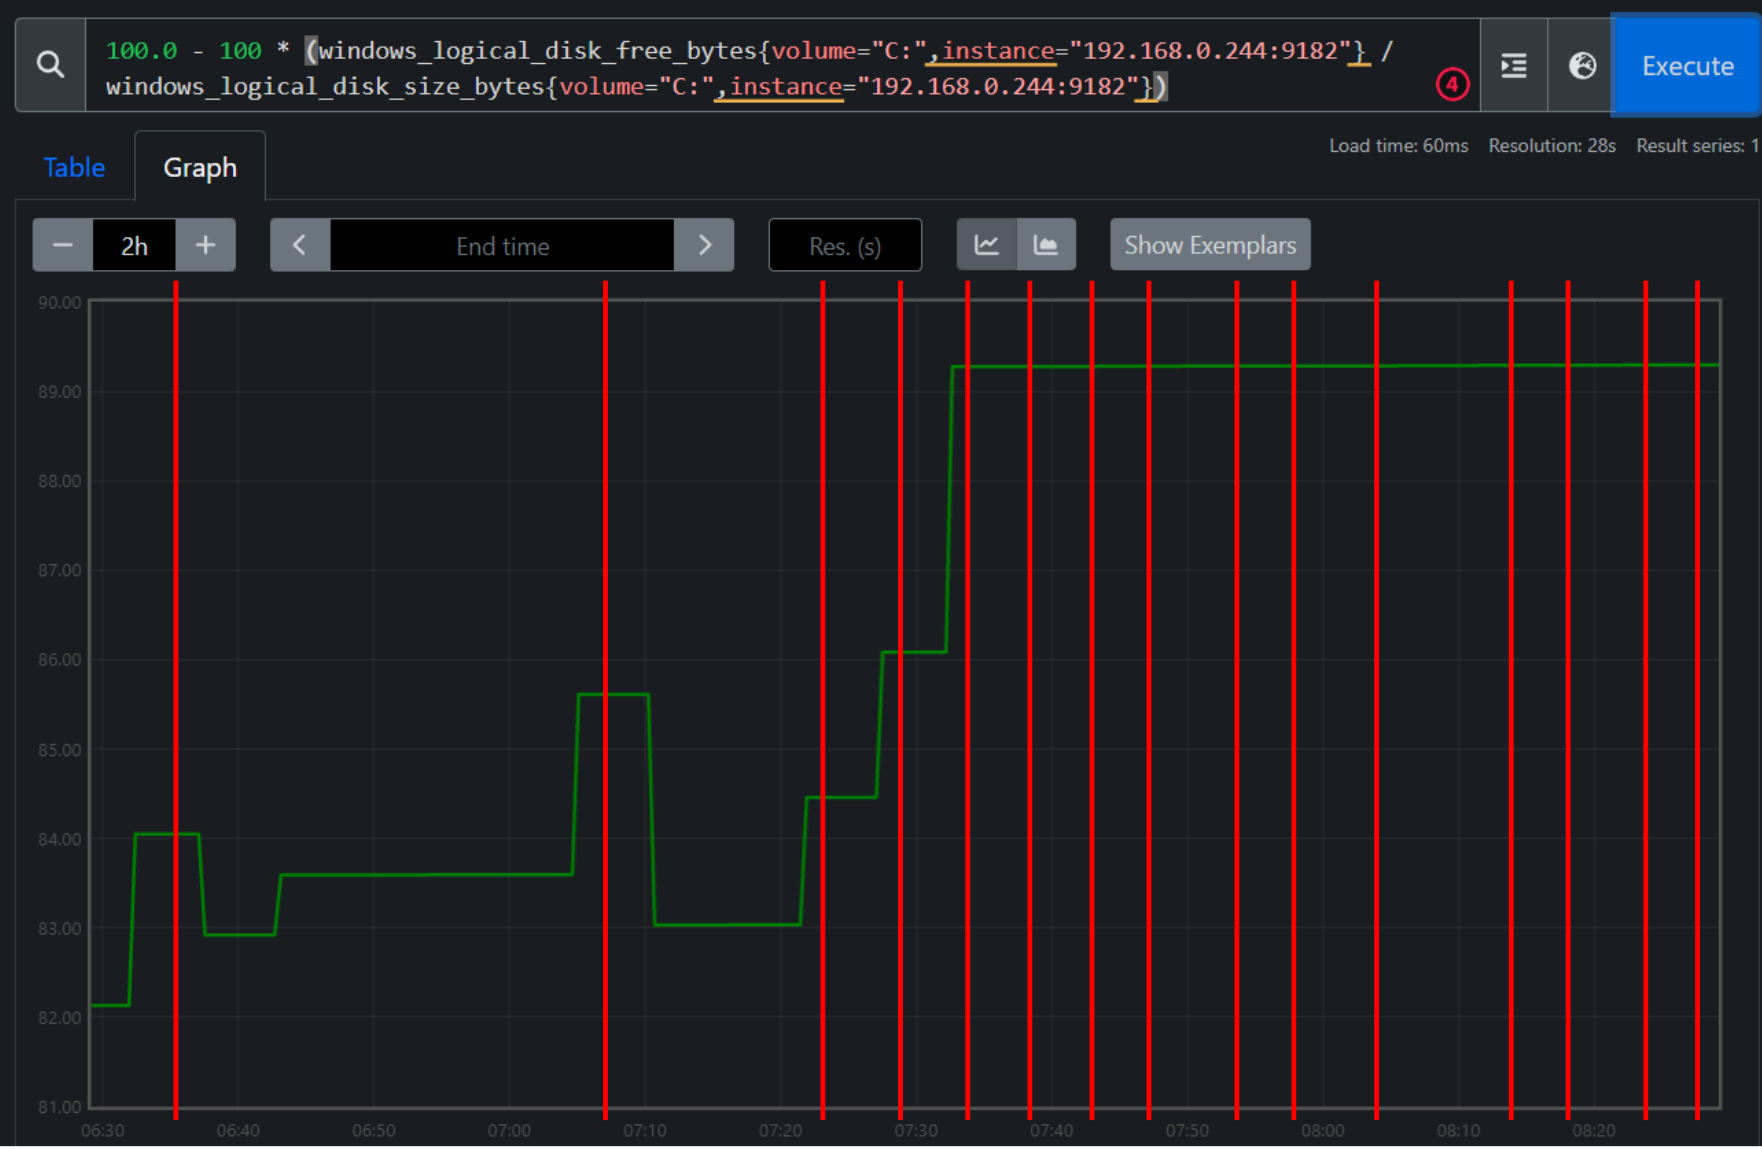
Let’s look at three examples:
"Image garbage collection failed multiple times in a row" err="failed to garbage collect required amount of images. Wanted to free 51010617344 bytes, but freed 0 bytes"When looking at
ctr i lsthe sum of image sizes is ~160 GiB (real value likely is lower because of shared image layers). The images that were said to be removed by the GC don’t appear here:crictl imagefsinfoalso tells that images are only using 92 GiB:But disk usage shows 406 GiB usage:
Seems like the reference of the images is deleted but not the actual files. Is there any way to get the sha’s of the snapshots so I can compare them to the sha`s in the GC log that were said to be deleted?
kubectl describe node akswin2000003shows GC failures:But it doesn’t show disk pressure:
Similar issue (without solution): https://github.com/rancher/rke2/issues/3090#issue-1278133402