kube-aggregator: aggregator_unavailable_apiservice metrics is greater than 0, although the API service is available
We’re using kubernetes-mixin, and one of the alerts this project add is on aggregator_unavailable_apiservice. When looking on this metric, there seems to be an issue with the metrics server:
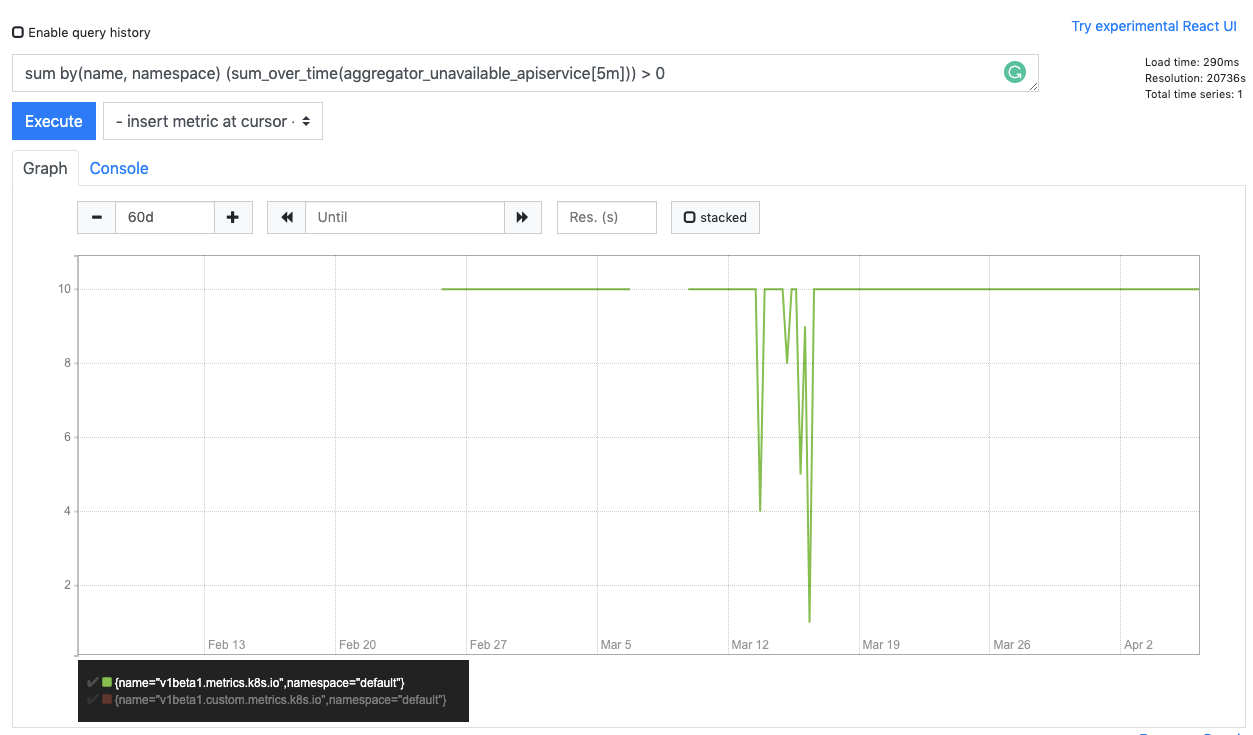
But when looking at the logs of the API server or describing metrics server API service everything seems fine:
kubectl get apiservice v1beta1.metrics.k8s.io -o yaml
apiVersion: apiregistration.k8s.io/v1
kind: APIService
metadata:
  annotations:
    kubectl.kubernetes.io/last-applied-configuration: |
      {"apiVersion":"apiregistration.k8s.io/v1beta1","kind":"APIService","metadata":{"annotations":{},"labels":{"app":"metrics-server","argocd.argoproj.io/instance":"metrics-server","chart":"metrics-server-2.10.0","heritage":"Tiller","release":"metrics-server"},"name":"v1beta1.metrics.k8s.io"},"spec":{"group":"metrics.k8s.io","groupPriorityMinimum":100,"insecureSkipTLSVerify":true,"service":{"name":"metrics-server","namespace":"kube-system"},"version":"v1beta1","versionPriority":100}}
  creationTimestamp: "2020-03-01T09:22:57Z"
  labels:
    app: metrics-server
    argocd.argoproj.io/instance: metrics-server
    chart: metrics-server-2.10.0
    heritage: Tiller
    release: metrics-server
  name: v1beta1.metrics.k8s.io
  resourceVersion: "53751475"
  selfLink: /apis/apiregistration.k8s.io/v1/apiservices/v1beta1.metrics.k8s.io
  uid: 3d4aa506-5b9e-11ea-bddc-12bb22683ea1
spec:
  group: metrics.k8s.io
  groupPriorityMinimum: 100
  insecureSkipTLSVerify: true
  service:
    name: metrics-server
    namespace: kube-system
  version: v1beta1
  versionPriority: 100
status:
  conditions:
  - lastTransitionTime: "2020-03-09T18:35:19Z"
    message: all checks passed
    reason: Passed
    status: "True"
    type: Available
What am I missing? Is this a real issue?
About this issue
- Original URL
- State: closed
- Created 4 years ago
- Reactions: 30
- Comments: 16 (3 by maintainers)
After upgrading the prometheus operator we are seeing the same thing as @den-is. Only one apiserver returns a value > 0
Also, when I get the apiservice via kubectl it shows that it is available:
@omerlh We had the same issue after upgrading the prometheus operator chart with only one master having the gauge out of synch. After spending a lot of time into it I think the problem is not with us. Unless you have k8s 1.18 look at: https://github.com/kubernetes/kubernetes/pull/87778 Hope it helps.
I’ve encountered the same issue. this is the rule AggregatedAPIDown somehow one of the 3 apiservers return value > 0
reloading prometheus, restarting kube-apiserver didn’t help
I just noticed that we have difference in the metrics between the master, I’m digging into that now
For me it seemed like this was more on Prometheus’ side.
When looking at what Prometheus was actually scraping I saw the real value is
0:But in Prometheus that value still was showing as
1. Some sort of race condition with watchers?For me what solved it was execing into the prometheus container and running:
That graceful shutdown let Prometheus finally show the correct value: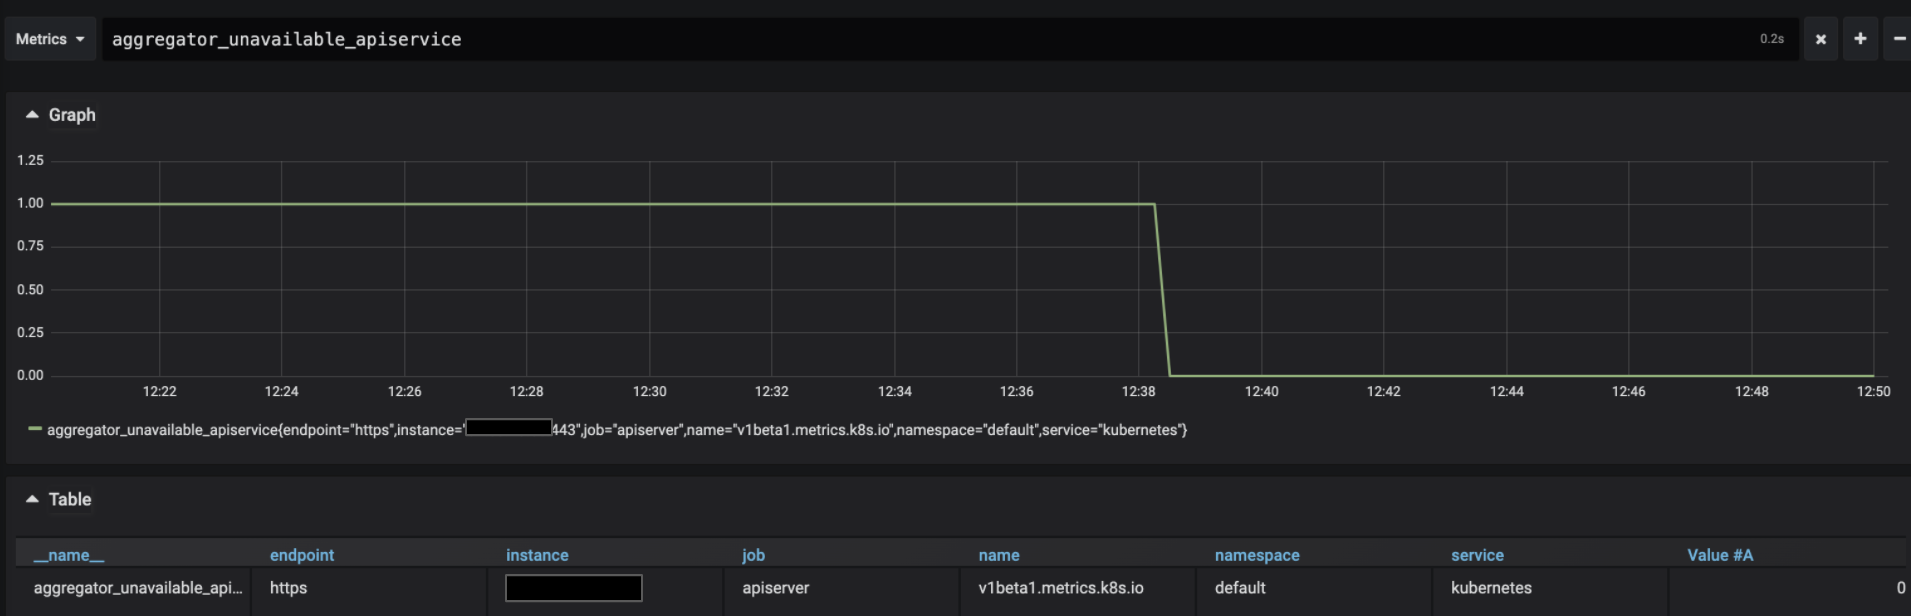
Then the real value of the metric was reflected. Hope this helps!