serving: pod number decreased extremely when panic-window passed
In what area(s)?
/area autoscale
Ask your question here:
We are trying to test knative autoscaling with a simple helloworld Golang application, and trying to scale as much as possible pods with knative to check the behavior under extreme situation.
So, we set CC=10, and use vegeta to add workload with rate 3000/s (given it is helloworld, the rate here is rps, not concurrency).
queue-proxy / user-container cpu.limit are set to 100m, memory.limit are set to 1Gbi
tbc=0 to ensure no activator in path
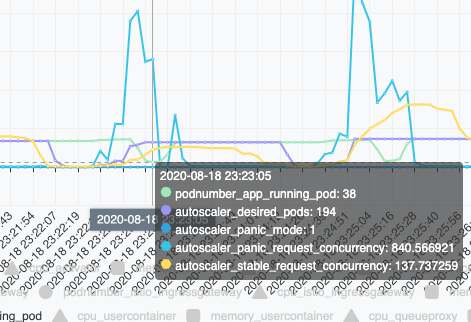
See the picture below,
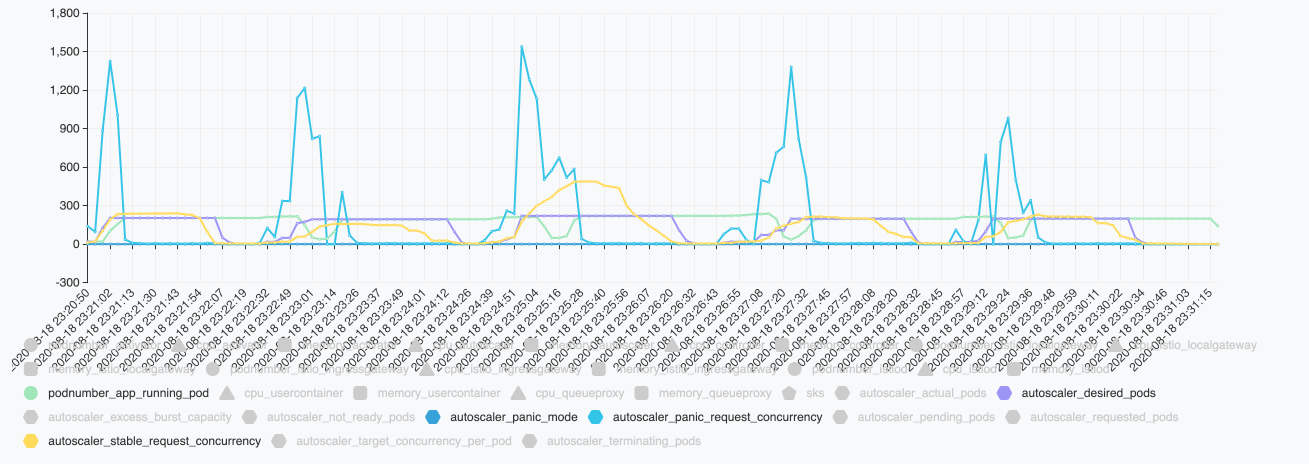
The yellow line is the stable-request-concurrency of the target application fetched from autoscaler
The blue line is the panic-request-concurrency of the target application fetched from autoscaler
The purple line is the desired pod number reported by autoscaler.
The green line is the running pod number from kubectl get pods | grep -c running
The issue I would like to raise here is that , why the pod number decreased extremely and then increased again? Can we avoid the fluctuation like that ?
Let us see the picture with more details.
First, when the workloads increased, the panic concurrency is very high, up to 204 pods are added and running during the panic window
 Then, with the 200+ pods running, the incoming requests can be consumed by the application very quickly, with results in very very low concurrency, so the panic concurrency decreased. After a while, even stable-request-concurrency decreased.
After 60 seconds, the given panic window expires … When the desired pod is computed by the stable-request-concurrency, but even the stable-concurrency is not high enough now … The desired pod number decreased quickly. https://github.com/knative/serving/blob/fde07b7db56b18a117ea36a5a0e978df427b1cff/pkg/autoscaler/scaling/autoscaler.go#L214-L222
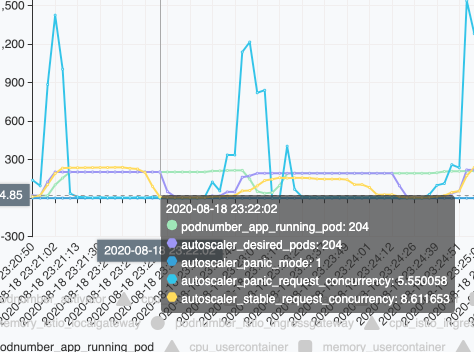
In above picture, we saw the desired pod is 204 on 23:22:02 with panic mode =1
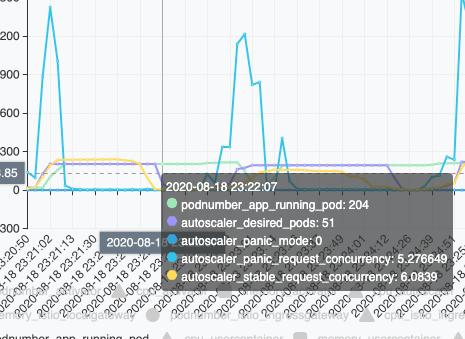
Then, the desired pod is 51 on 23:22:07 (5 seconds later) with panic mode =0
Furthermore, the desired pod is 1 on 23:22:19 (17 seconds later)
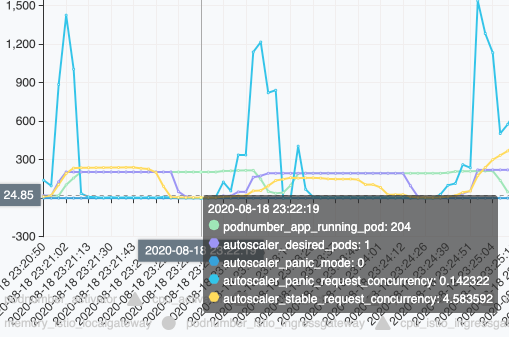
Then ,the desired pod setting took a little bit time to take effects. With less pod number, panic concurrency increased extremely again when the running pod number reached to 38.
 As a result , a new panic window cycle starts, and repeats over and over. That is why I saw the fluctuation.
Question:
Is that possible to consider enhance autoscaler algorithm to avoid the unstable scenario?
For example, once the panic window is over, if the desired pod is much less than current running pod value (i.e less than 50% of current running pod number), then add a compensation to make the scale down not so aggressive.
i.e. the most simplest way …
desiredPodCount := desiredStablePodCount
if   desiredPodCount < 0.5 * originalReadyPodsCount {
  desiredPodCount = 0.5 * originalReadyPodsCount
}
Any comment?
About this issue
- Original URL
- State: closed
- Created 4 years ago
- Reactions: 1
- Comments: 17 (17 by maintainers)
@cdlliuy pushed a new version to same branch that applies the delay to the desiredPodCount rather than the stable metric (i.e. it applies to the output of algorithm instead of the input). Think that’ll work better here because it will account for panic pods properly.