mini-graph-card: Wrong last bar value - always zero.
Last bar on graph is wrong, also hours to show omitting last day (history-graph show one day more with 720 hours).


aggregate_func: max
cache: false
color_thresholds:
  - color: '#f0f042'
    value: 15
  - color: '#f0e342'
    value: 7.5
  - color: '#d0c442'
    value: 5
  - color: '#c0c042'
    value: 0
entities:
  - entity: sensor.daily_pv4
    index: 0
    name: Dzienna produkcja PV
group_by: date
hours_to_show: 720
icon: 'mdi:solar-power'
show:
  graph: bar
type: 'custom:mini-graph-card'
entities:
  - entity: sensor.daily_pv4
hours_to_show: 720
refresh_interval: 0
type: history-graph
About this issue
- Original URL
- State: closed
- Created 4 years ago
- Comments: 22 (9 by maintainers)
Commits related to this issue
- Fixed incorrect value for the first point #289 (#327) Reset seconds & milliseconds when calculating end time — committed to kalkih/mini-graph-card by maxwroc 4 years ago
Okay, will make a release tonight 🙃
Out now ➡️ v0.9.4
@kalkih - I didn’t read that it was about the browser console 😉 I was looking for this in the HA dev console 😃
Browser console show 0.9.3 😃 I also have set cache: false
I have exactly the same issue. Any news on this?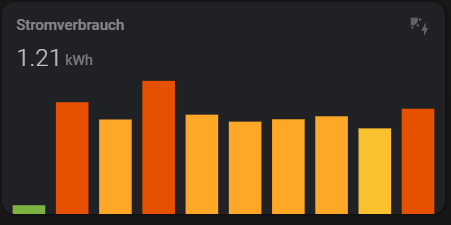 Everything looks fine, except for the last bar which is always zero. I’m also using Version 0.9.3
I have the same, oldest day is always show as zero. Eg. 168 hours, as You see most left blue value (tuesday) show 0. Please note too on the marked value from Sunday (dirty yellow) which shows 5,28kWh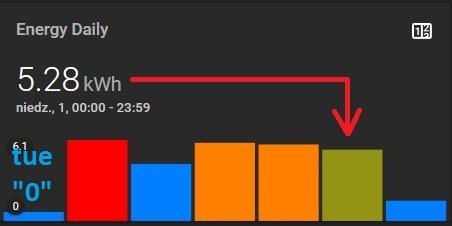
but when I reduce the period to 48 hours, the most to the left will be Sunday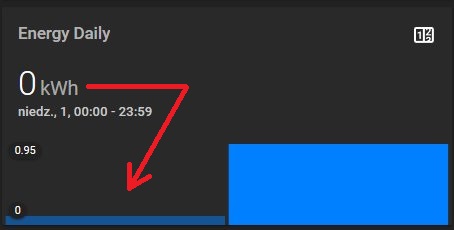 which shows now the 0 value