k3s: k3s causes a high load average
Describe the bug I’m not sure if it’s a bug, but I think it’s not an expected behaviour. When running k3s on any computer, it causes a very high load average. To have a concrete example, I’ll explain the situation of my raspberry pi3 node.
When running k3s, I have a load average usage of:
load average: 2.69, 1.52, 1.79
Without running it, but still having the containers up, I have a load average of:
load average: 0.24, 1.01, 1.72
To Reproduce
I just run it without any special arguments, just how is installed by the sh installer.
Expected behavior The load average should be under 1.
About this issue
- Original URL
- State: closed
- Created 5 years ago
- Reactions: 45
- Comments: 69 (11 by maintainers)
I’ve investigated about the load average and how it works. And it does in fact make sense that in a raspberry pi 3, that has 4 cores, the load avearge is of from 1 to 4.
I do still think that a load average of 2.69 for a master with little usage is too much, but since it’s inside of what is supported, I’ll close this issue.
If somebody doesn’t agree, feel free to open another one or reopen this one.
PD: In the same machine, an agent without containers does have like 0.3 of load average, FYI.
The discussion is not about startup. It is during operation. Load on my k3s master mode (regardless of what hardware I’m using) is always around 25% on an otherwise idle setup.
This issue still seems trivial to reproduce across any hardware. Despite being closed for over 2 years it still has tons of activity and consistent reports. I gave up on k3s long ago because of it.
Suggestions:
I’m still seeing this in the latest releases. Both on Intel and ARM CPUs, load is high - and I don’t mean load average, I’m seeing 20-30% CPU load on single-core VMs.
Same behavior with my tests.
k3s consumes always about 20% CPU in top after initialization. 18% away from using it on an Edge device. 20% for a management tool when idling is a joke. A full installed Apache, PHP, MariaDB, Gitea, Postfix, Dovecot all in Docker Containers jumps around 3-5% when idling. On a slow Raspberry 3.
Easy to reproduce.
The latest version 0.8.1 also suffers from this problem. I wonder how someone would run k3s on a low-power edge device when k3s itself consumes so many CPU cycles.
Here’s darkstar’s flamegraph for anyone driving by
@darkstar From that flamegraph we can see the entire time is spent inside containerd but we don’t have symbols to get any introspection on the stack there. We can see about half of the time is spent purely within containerd and a little bit less than the other half ends up in a system call el0_sync from containerd.
To get a more full picture make sure you’re compiling k3s-server with debug symbols so we can get more detail on the stacktrace for both k3s and containerd. I really don’t know this project that well but a quick look shows this build script omitting debug symbols with
-w. Ensure after you recompile the binary that you still get similar results w.r.t. cpu load. That new binary’s flamegraph will tell us more.@brandond Those numbers seem unreasonably high. I think I remember plain k8s deployed with kubeadm to a single node taking ~3-5% on a consumer Intel Skylake 3.1Ghz. There is likely some optimization that can be done here.
I was also able to replicate this pretty trivially on Ubuntu 18.04. This is with a cluster with nothing deployed to it and yet the k3s server consumed 20-30% cpu. I also evaluated microk8s and standard kubernetes deployed with kubeadm. Both only consumed about ~3% cpu at idle with nothing deployed on the same machine. These results were consistent across attempts and after I applyed deployments to the cluster. The load was immediate right after bring up. No logs emitted from the server suggest something going wrong.
This a show stopper for me moving forward with k3s unfortunately.
@bertbesser I have applied this configuration to my k3s nodes and all of them seem usable and way more predicable.
Here is an overview over my CPU pre/post change at 11:00~
This is a reasonably high-power cluster but it seem to make even that better. I deployed it to some low power machine that earlier just became unresponsive (over SSH) after a while and they seem to work now.
Good job, I wonder if this would be a good enough pointer to the fact that something must be wrong with k3s?
I’ve investigated my problem and found a workaround. However, I’m not certain yet that it works as intended. Still, I’m going to share–feel free to discuss. 😃
The load is generated in relatively small part by k3s, whereas the major load comes from a containerd sub-process of k3s and containerd’s threads. See tree structure in the following screenshot.
Note that in the screenshot I have already applied the workaround. That’s why the overall load of k3s and containerd does not hog the entire CPU.
The workaround is as follows. k3s is a systemd service. So I configured its service file to limit k3s’ cgroup’s CPU consumption. I’m on ubuntu, so I edited /etc/systemd/system/k3s.service. I added the following lines to the
[Service]section:I’m not convinced, yet, that it’s an adequate workaround. I’m afraid to restrict k3s CPU too much to function properly. As of yet, however, my services and jobs run fine. Note that services, jobs, etc. are not affected by the workaround, i.e. they still can use arbitrary CPU. Indeed, this speeds up my services since they now have more CPU left that’s not eaten by k3s.
I am mostly seeing crazy high read load, triggering the k3s to become unresponsive: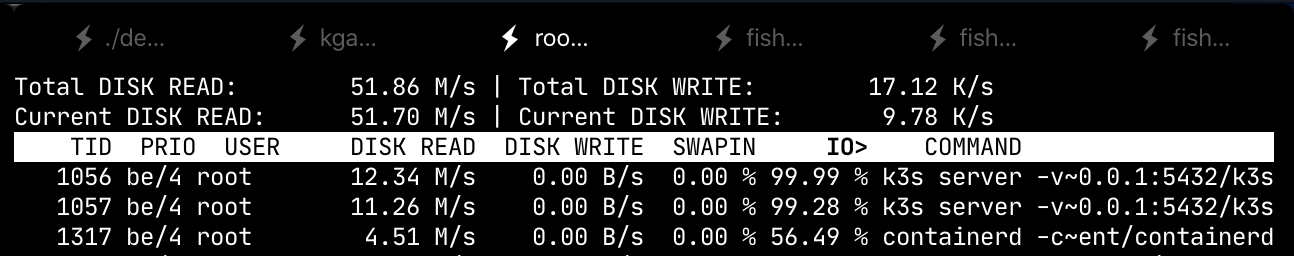
While the CPU is barely used: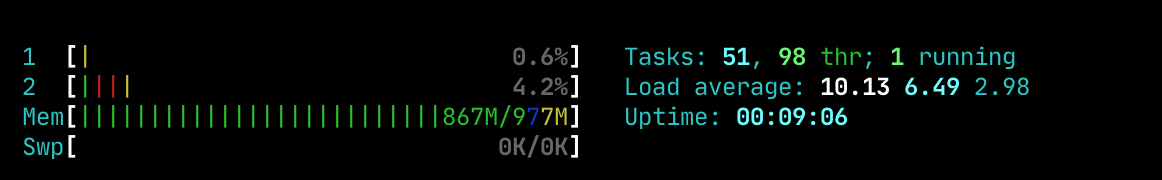
This is using a PostgreSQL db, on the same host. But the read does not seem to be related to that.
I’m going to post here even if the issue is closed given the fact that many other users are experiencing the same problem.
High cpu usage on master node (50% cpu avg on all cores) on 2 Nodes cluster
rpi4 - 8Gb - Ubuntu 20 64bitnon-HA.Profiling Enable pprof profiling using
--enable-pprofon the master. Gather profile output using pprof serverurl --insecure "https://<master>:6443/debug/pprof/profile?seconds=300" > profile.pprofResults
This may be specific to my workload so it would be nice to gather some profiles from other clusters/workloads to narrow down the issue.
The most cpu busy calls are related to sqllite and some file read sys call.
profile svg
That’s another problem, but unrelated. I’m using k3s with external PostgreSQL (no etcd anywhere), and idle k3s process regularly used ~30% CPU.
I’m seeing about 20-25% cpu usage of a single Skylake Xeon core constantly. Is this expected behaviour? With https://microk8s.io it’s only a couple percent.
Seeing the same on k3s v1.23.6, 3 masters, 3 workers all Ubuntu 22.04
Here the problem was connected to k3s and iptables, when dumping
iptables -L > /tmp/iptables, the file was 7mb big. I’ve had this problem only on Debian Buster. When I was still running k3s on Ubuntu (cannot remember which version), I didn’t have this problem. After upgrading Debian from Buster to Bullseye, the problem entirely disappeared.