jest: Memory Leak on ridiculously simple repo
You guys do an awesome job and we all appreciate it! 🎉
🐛 Bug Report
On a work project we discovered a memory leak choking our CI machines. Going down the rabbit hole, I was able to recreate the memory leak using Jest alone.
Running many test files causes a memory leak. I created a stupid simple repo with only Jest installed and 40 tautological test files.
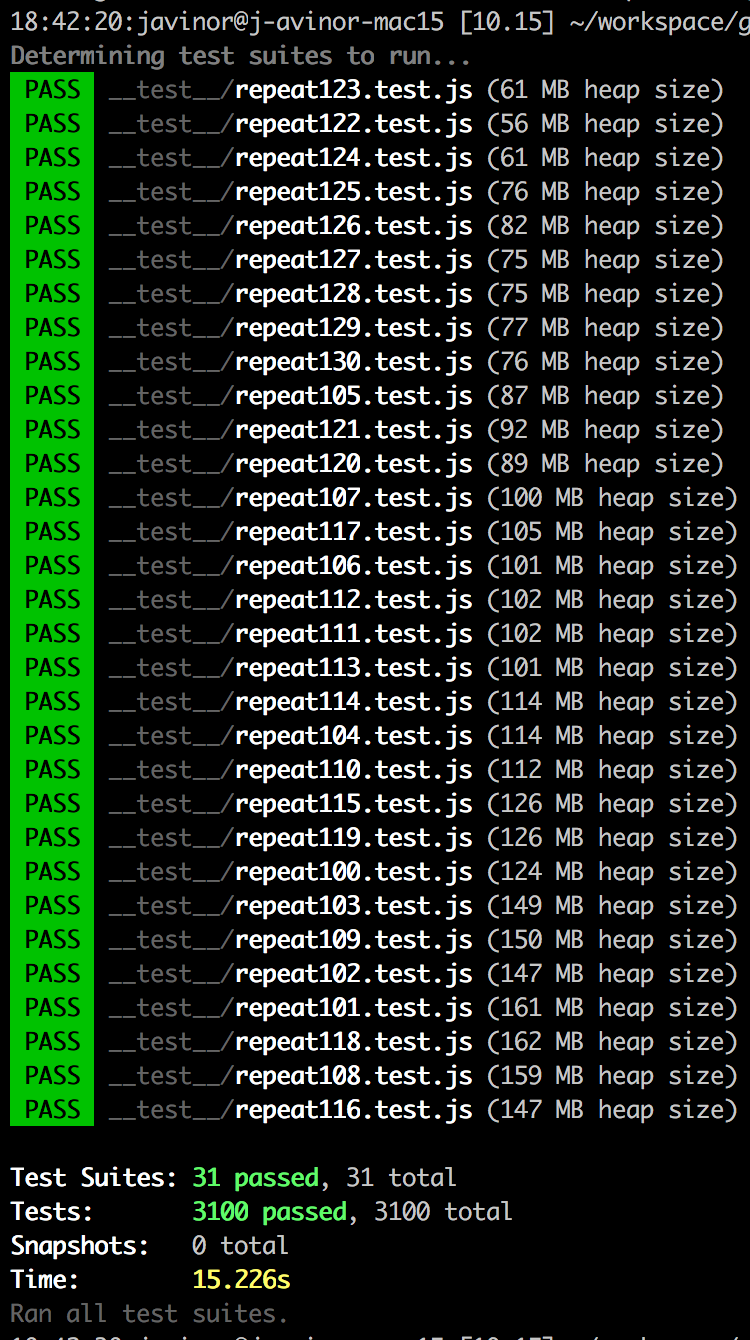
I tried a number of solutions from https://github.com/facebook/jest/issues/7311 but to no avail. I couldn’t find any solutions in the other memory related issues, and this seems like the most trivial repro I could find.
Workaround 😢
We run tests with --expose-gc flag and adding this to each test file:
afterAll(() => {
  global.gc && global.gc()
})
To Reproduce
Steps to reproduce the behavior:
git clone git@github.com:javinor/jest-memory-leak.git
cd jest-memory-leak
npm i
npm t
Expected behavior
Each test file should take the same amount of memory (give or take)
Link to repl or repo (highly encouraged)
https://github.com/javinor/jest-memory-leak
Run npx envinfo --preset jest
Paste the results here:
System:
    OS: macOS High Sierra 10.13.6
    CPU: (4) x64 Intel(R) Core(TM) i7-5557U CPU @ 3.10GHz
  Binaries:
    Node: 10.15.0 - ~/.nvm/versions/node/v10.15.0/bin/node
    Yarn: 1.12.3 - /usr/local/bin/yarn
    npm: 6.4.1 - ~/.nvm/versions/node/v10.15.0/bin/npm
  npmPackages:
    jest: ^24.1.0 => 24.1.0
About this issue
- Original URL
- State: open
- Created 5 years ago
- Reactions: 181
- Comments: 112 (30 by maintainers)
Commits related to this issue
- Fix jest test in CI Jest runs out of memory when run in Docker, possibly because of a memory leak in ts-jest. The tests will now run after the build, on the built *.js files. As a consequence, the j... — committed to rondomoon/rondo-framework by jeremija 4 years ago
- request #21420 jest: 26.6.3 -> 27.2.4 Release notes: https://jestjs.io/blog/2021/05/25/jest-27 ts-jest changelog: https://github.com/kulshekhar/ts-jest/blob/v27.0.5/CHANGELOG.md Packages using angu... — committed to Enalean/tuleap by LeSuisse 3 years ago
- try https://github.com/facebook/jest/issues/7874 — committed to cramhead/test-test by deleted user 3 years ago
- build(deps): allow axios `>=0.25.0 || ^1.2.2` Versions of Axios 1.x are causing issues with Jest (https://github.com/axios/axios/issues/5101). Jest 28 and 29, where this issue is resolved, has other... — committed to swan-bitcoin/node-marketo by ramontayag a year ago
I’ve run some tests considering various configurations. Hope it helps someone.
Similar here, jest + ts-jest, simple tests get over 1GB of memory and eventually crash.
Quick Recap
jest@23works as expected - heap size oscillates but goes down to original - it appears like the GC is succeeding to collect all memory allocated during the testsjest@24+includingjest@26.6.3- heap size continues to grow over time, oscillating, but doesn’t seem to go down to the initial size - My assumption is that there’s a memory leak preventing GC for freeing up all the memory@SimenB help? 🙏
Running with
jest@23Running with
jest@26Jest 25.1.0 has the same memory leak issue.
Here are my findings.
Did a study on 4 of our apps, made a benchmark with the following commands.
NB: “order” is the rank of the test within the running of the command e.g. 1 means it has been ran first, it’s just the order in which the console outputs the test result at the end.
EDIT: All of this is running on my local machine, trying this on the pipeline was even more instructive since only the case where there’s GC and no RIB results in 100% PASS. Also GC makes it twice as fast, imagine if you had to pay for memory usage on servers.
EDIT 2: case C has no
--coverage --cioption but it does not impact performance. I added a chart to measure average pipeline speed with above scenarios. The graph is the average time of tests job on pipeline, 3 execution for each case, regardless of test outcome (All Pass vs some failing tests, because at the moment of collecting data some tests were unstable).Cross apps Max Heap
Average Heap
App1 Max Heap and Average Heap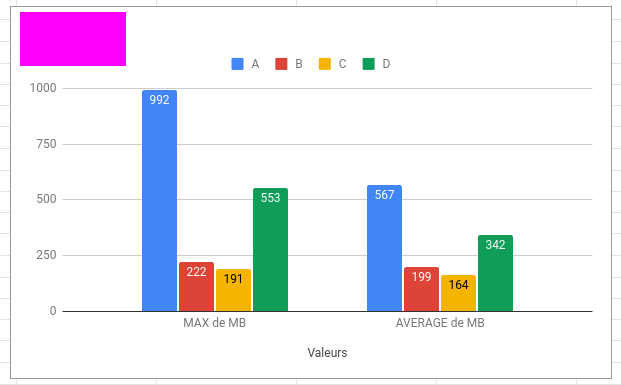
Heap Chronology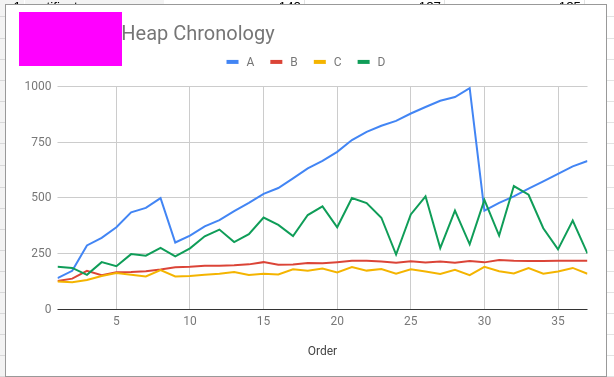
File Based Heap (x axis is file path)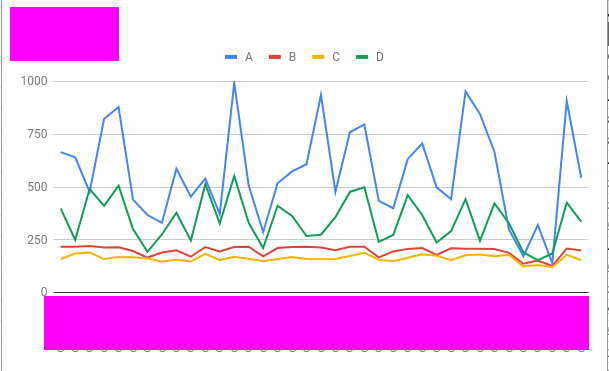
App2 Max Heap and Average Heap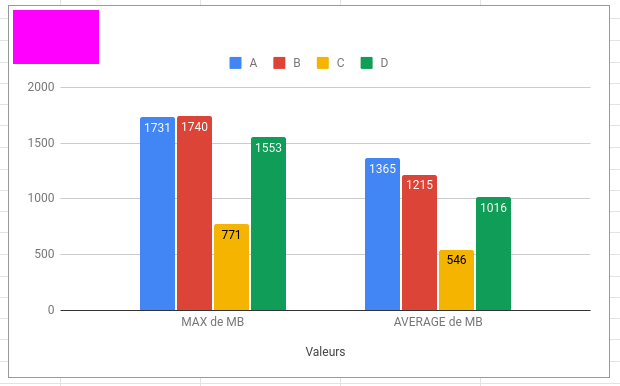
Heap Chronology
File Based Heap (x axis is file path)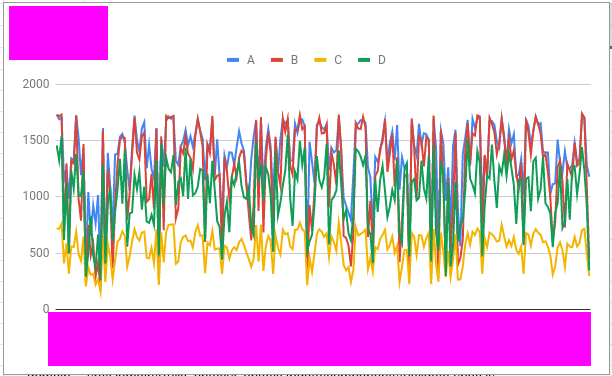
App3 Max Heap and Average Heap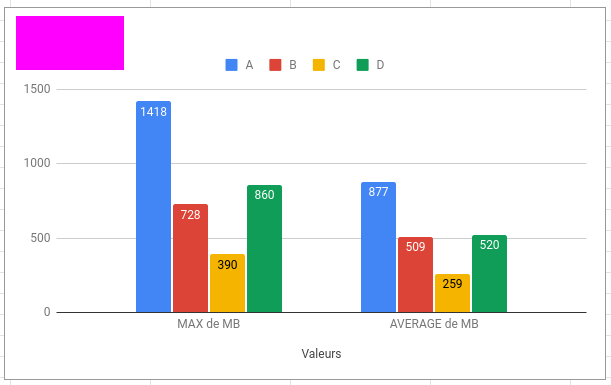
Heap Chronology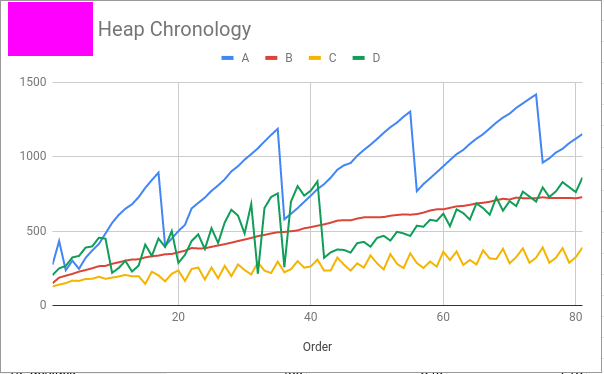
File Based Heap (x axis is file path)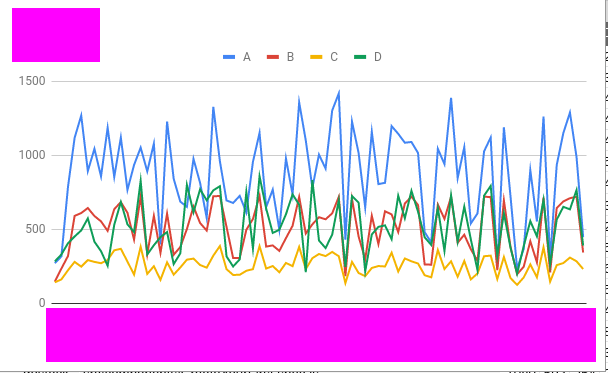
App4 Max Heap and Average Heap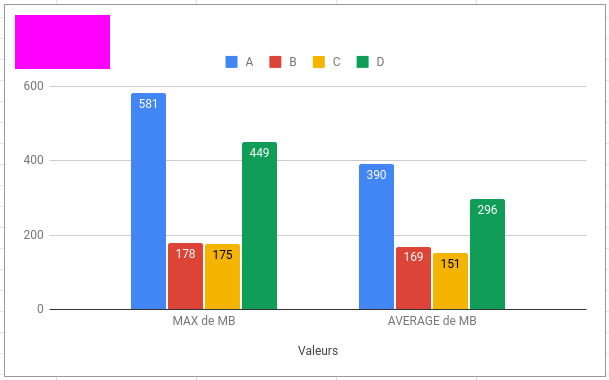
Heap Chronology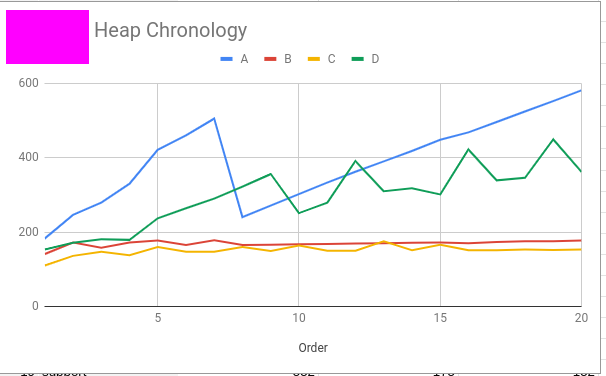
File Based Heap (x axis is file path)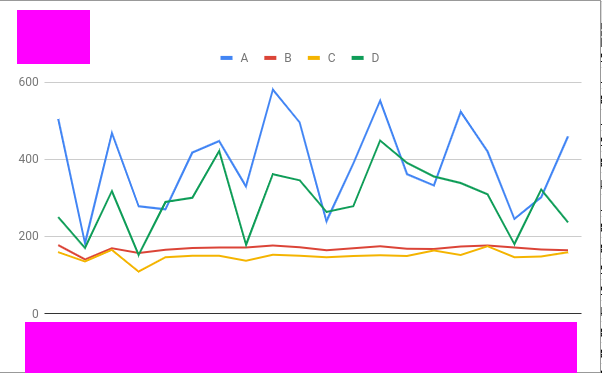
Rank of appearance of the highest heap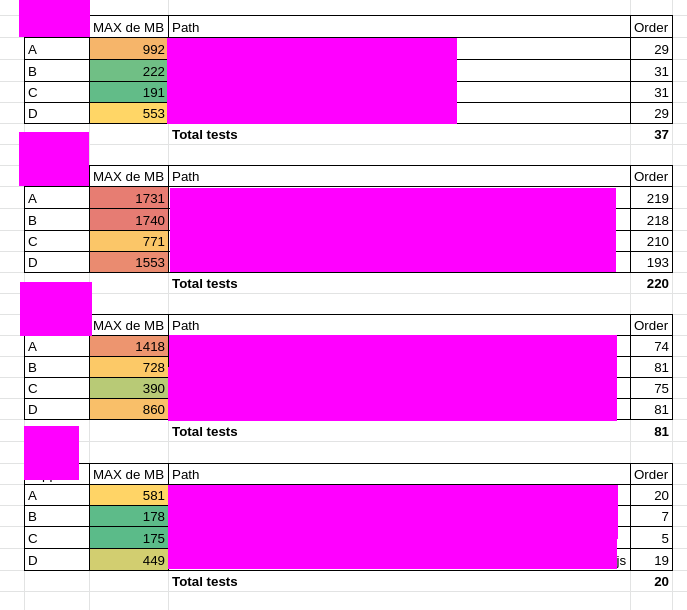
App 1 Average time of execution for the test job out of 3 pipelines for App1.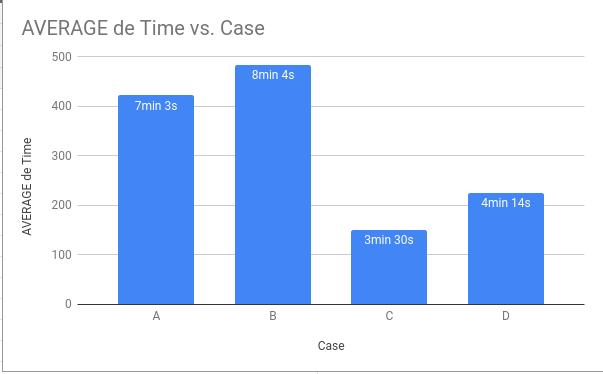
Hope this helps or re-kindles the debate.
Hey guys, my team also encounter this issue, and we would like to share our solution.
Firstly, we need to understand that Node.js will find its best timing to swipe unused memory by its own garbage collection algorithm. If we don’t configure it, Node.js will do their own way.
And we have several ways to configure / limit how garbage collection works.
--expose-gcflag :If we add this flag while running node.js, there will be a global function calledgcbeing exposed. If we callglobal.gc(), node.js will swipe all known unused memory.--max-old-space-size=xxx: If we add this flag while running node.js. We are asking node.js to swipe all known unused memory if unused memory has reach xxx MB.Secondly, I think we have 2 types of memory leak issue.
Type 1: Node.js knows that there are some unused memory, but he think that doesn’t matter his process, so he didn’t swipe unused memory. However, he ran out of all memory on his container / device.
Type 2: Node.js doest NOT know that there exists some unused memory. Even he swipe all unused memory, he still consumed too much memory and finally run out all memory.
For Type 1, it’s easier to solve. We can use
--expose-gcflag and runglobal.gc()in each test to swipe unused memory. Or, we can add--max-old-space-size=xxxto remind node.js to swipe all known unused memory once it reached limit.Before adding
--max-old-space-size=1024:After adding
--max-old-space-size=1024:(Note: if we specify lower size, it will of course use less unused memory, but more frequent to swipe it)
For Type 2, we may need to investigate where memory leaks happened. This would be more difficult.
Because in our team, main cause is Type I issue, so our solution is adding
--max-old-space-size=1024to Node.js while running testsFinally, I would like to explain why
--expose-gcworks in previous comment.Because in Jest source code, if we add
--logHeapUsageto Jest, Jest will callglobal.gc()ifgcexists. In other words, if we add--logHeapUsageto Jest and add--expose-gcto Node.js, in current version of Jest, it will force Node.js to swipe all known unused memory for each run of test.However, I don’t really think adding
--logHeapUsageand--expose-gcto solve this issue is a good solution. Because it’s more like we “accidentally” solve it.Note:
--runInBand: ask Jest to run all tests sequentially. By default, Jest will run tests in parallel by several workers.--logHeapUsage: log heap memory usage in each test.Did a heap snapshot for my test suite and noticed that the majority of the memory was being used by strings that store entire source files, often the same string multiple times!
The size of these strings continue to grow as jest scans and compiles more source files. Does it appear that jest or babel holds onto the references for the source files (for caching maybe) and never clears them?
+1, we are also running into this issue. Jest is using over 5GB per worker for us. Our heap snapshots show the same thing as above. Any updates would be greatly appreciated.
TLDR - The memory leak is not present in version 22.4.4, but starts appearing in the subsequent version 23.0.0-alpha.1. The following steps are for (1) the community to assert/refute this and then (2) find the offending commit(s) causing the memory leak and increased memory usage.
In https://github.com/facebook/jest/issues/7874#issuecomment-639874717, I mentioned that I created a repo jest-memory-leak-demo to make this issue easier to reproduce in local and Docker environments.
I took it a step further and decided to find the version that the memory leak started to show. I did this by listing all the versions returned from
yarn info jest. Next, I manually performed a binary search to find the versions where versionidoes not produce a memory leak and versioni + 1does produce a memory leak.Here is my env info (I purposely excluded the
npmPackagessince the version was the variable in my experiment):The key finding is in jest-memory-leak-demo/versions.txt#L165-L169. You can see several iterations of the binary search throughout the file. I did one commit per iteration, so you also can examine the commit history starting at edc0567ad4710ba1be2bf2f745a7d5d87242afc4.
The following steps are for the community to validate these initial findings and ultimately use the same approach to find the offending commit causing the memory leaks. Here’s a StackOverflow post that will help: “How to get the nth commit since the first commit?”.
It would also be great if someone can write a script to do this in jest-memory-leak-demo. ~The most challenging part of doing this is programming memory leak detection~ edit: The script doesn’t have to decide whether or not a test run yields a memory leak or not - it can take a commit range and produce test run stats at each commit. A list of versions can be found by running
yarn info jest. I don’t have time to do this at the moment.Hi,
We experiments the same issue about memory leaks with our Angular 13 app We try the
--detect-leaksas suggested above and it seems to work but only with node 14 (14.19.1)npx jest-heap-graph "ng test --run-in-band --log-heap-usage --detect-leaks"Here the heap graph for 14.19.1 :
Here the heap graph for 16.14.2 :
We also tried the coverageProvider set to babel as here https://github.com/facebook/jest/issues/11956#issuecomment-1112561068 no change We guess our tests may are not perfectly well written but there still leaks
EDIT
Downgrade to node 16.10.0 seems to work
jest-memory-leak-demo
I’ve been experiencing memory leaks due to this library and it has made it unusable on one of the projects I’m working on. I’ve reproduced this in jest-memory-leak-demo, which only has jest as a dependency. I’ve reproduced this on macOS and within a Docker container using the
node:14.3.0image.In jest-memory-leak-demo, there are 50 test files with the following script:
Running a test yields 348 MB and 216 MB heap sizes in macOS and Docker, respectively.
However, when I run with node’s gc exposed:
it yields 38 MB and 36 MB heap sizes in macOS and Docker, respectively.
Looking into the code, I see that
jest-leak-detectoris conditionally constructed based on the config. So if I don’t run jest with--detectLeaks, I expect exposing the gc to have no effect. I searched jest’s dependencies to see if any package is abusing the gc, but I could not find any.Is there any progress on this issue?
It’s great that some folks think the memory leak issue is somehow not a big deal anymore, but we’re at jest 27 and we have to run our builds at Node 14 even though we will ship with Node 16 so that our test suite can finish without running out of memory. Even at Node 14, as our test suite has grown, we struggle to get our test suite to run to completion.
This works for me: https://github.com/kulshekhar/ts-jest/issues/1967#issuecomment-834090822
Add this to jest.config.js
Something that might be helpful for those debugging a seeming memory leak in you Jests tests:
Node’s default memory limit applies seperately to each worker, so make sure that the total memory available > number of workers * the memory limit.
When the combined memory limit of all of the workers is greater than the available memory, Node will not realized that it needs to run GC, and the memory usage will climb until it OOM’s.
Setting the memory limit correctly causes Node to run GC much more often.
For us, the effect was dramatic. When we had the
--max-old-space-size=4096and three workers on a 6GB machine, memory usage increased to over 3gb per worker and eventually OOM’d. Once we set it to 2gb, memory usage stayed below 1gb per worker, and the OOM’s went away.crashes for us too
strangely, running
node --expose-gc ./node_modules/.bin/jest --runInBand --logHeapUsage“fixes” the issue but running it withnpx jest --runInBand --logHeapUsageor./node_modules/.bin/jest --runInBand --logHeapUsageproduces a memory leakAs @UnleashSpirit mentioned, downgrading to node 16.10 fixed the memory issue with Jest.
When I
--logHeapUsage --runInBandon my test suite with about 1500+ tests, the memory keeps climbing from ~100MB to ~600MB. The growth seems to be in these strings, and array of such strings (source).It is apparent that the number of compiled files will grow as jest moves further in the test suite — but if this doesn’t get GC’ed, I don’t have a way to separate real memory leaks from increases due to more modules stored in memory.
On running a reduced version my test suite (only about ~5 tests), I was able to narrow down on this behaviour —
Let’s say we had — TEST A, TEST B, TEST C, TEST D
I was observing
TEST B. Without doing anything —If I reduce the number of imports
TEST Bis making, and replace them with stubs —This consistently reduced memory across runs. Also, the imports themselves did not seem to have any obvious leaks (the fall in memory corresponded with the number of imports I commented out).
Other observations:
Do I understand correctly that using the workaround to force GC runs makes the heap size remain constant? In that case it’s not really a memory leak, just v8 deciding not to run the GC because there is enough memory available. If I try running the repro with 50MB heap size
the tests still complete successfully, supporting this assumption.
One thing I came over when going through the list of issues was this comment: https://github.com/facebook/jest/issues/7311#issuecomment-578729020, i.e. manually running GC in Jest.
So I tried out with this quick and dirty diff locally:
So if running after every test file, this gives about a 10% perf degradation for
jest pretty-formatin this repo.However, this also stabilizes memory usage in the same way
--detect-leaksdoes.So it might be worth playing with this (e.g. after every 5 test files instead of every single one?). Thoughts? One option is to support a CLI flag for this, but that sorta sucks as well.
I’ll reopen (didn’t take long!) since I’m closing most other issues and pointing back here 🙂 But it might be better to disucss this in an entirely new issue. 🤔
This is going to sound bad but I have been struggling with the same situation as @pastelsky - memory heap dumps showing huge allocation differences in
arrayandstringbetween each snapshot and memory not being released after test run is completed.We have been running Jest from inside Node with
jest.runCLI, I tried everything suggested in this topic and in other issues on GitHub:The only thing that reduced memory by around 200MB was to switch off default
babel-jesttransformer since we did not need it at all:This has indeed reduced memory usage but still not to the level where we could accept it.
After two days of memory profiling and trying different things, I have just switched to
mocharunner since our tests were primarily E2E tests (no typescript, no babel, Node 12) making request to API it was fairly simple:testtoitbeforeAlltobeforeafterAlltoafterAfter deploying this, tests have been running with stable memory usage of 70MB and never going above while with Jest it was peaking at 700MB. I am not here to advertise mocha (my first time using it to run tests) but it literally just worked so if you have fairly simple test suites you could try changing your runner if you want to run tests programmatically.
experiencing the exact same issue with jest+ts-jest on a nestjs project
event the simplest test is reporting 500mb of heap size.
v27 seems to leak more memory. The test of my project never encountered OOM on v26, but it was killed on v27.
Found an article for how to use heap snapshot to debug jest memory leak here: https://chanind.github.io/javascript/2019/10/12/jest-tests-memory-leak.html I tried to use the same method to debug but didn’t find the root cause.
Even
global.gc()does not help for me, still seeing heap size keeps growing for each test.And that’s exactly my point in potentially closing this - that has next to nothing to do with the reproduction provided in the OP. Your issue is #11956 (which seemingly is a bug in Node and further upstream V8).
However, it seems the OP still shows a leak somewhere, so you can rest easy knowing this issue won’t be closed. 🙂
If it’s an issue for you at work, any time you can spend on solving this (or at least getting more info about what’s going on) would be a great help. It’s not an issue for me at work, so this is not something I’m spending any time investigating - movement on this issue is likely up to the community. For example gathering traces showing what is kept in memory that could (should) be GC-ed. The new meta issue @StringEpsilon has spent time on is an example of great help - they’re probably all a symptom of the same issue (or smaller set of issues), so getting the different cases listed out might help with investigation, and solving one or more might “inadvertently” solve other issues as well.
I have tested the reproduction with jest 24, jest 27 and jest 28 beta:
truefalsetruefalsetruefalse(All tested on node.js v14.15.3)
I think in general the leak has become less of an issue, but the discrepancy between --runInBand=true and --runInBand=false suggests that there is still an issue.
See also: #12142 (leak when using --runInBand) #10467 (duplicate of this issue) #7311 (leak when using --runInBand) #6399 (leak when using --runInBand)
As for the cause, from other issues relating to leaks, I suspect that there are multiple issues playing a role. For example:
#6738
[Memory Leak] on module loading#6814Jest leaks memory from required modules with closures over imports#8984jests async wrapper leaks memory#9697Memory leak related to require(might be a duplicate of / has common cause with 6738?) #10550Module caching memory leak#11956[Bug]: Memory consumption issues on Node JS 16.11.0+And #8832 could either be another --runInBand issue or a require / cache leak. Edit: It seems to be both. It leaks without --runInBand, but activating the option makes the problem much worse.
There are also leak issues with coverage, JSDOM and enzyme #9980 has some discussion about that. And #5837 is directly about the
--coverageoption.Addendum: it would probably be helpful to have one meta-issue tracking the various memory leak issues and create one issue per scenario. As it currently stands, all the issues I mentioned above have some of the puzzle pieces, but nothing is tracked properly, the progress that was made isn’t apparent to the end users and it’s actually not easy to figure out where to add to the conversation on the general topic. And it probably further contributes to the creation of duplicate issues.
This is a dummy post to report this issue is still present and makes TDD harder so I’ll look forward to any solution
There must be something else wrong because I’m currently using Jest v23.6 and everything works fine, no memory leaks, no anything.
If I upgrade to latest Jest then the memory leaks start to happen, but only on the GiLab CI runner. Works fine locally.
@SimenB I have drafted a meta issue: https://gist.github.com/StringEpsilon/6c8e687b47e0096acea9345f8035455f
For those wanting to get their CI pipeline going with
jest@26, I found a workaround that works for me. (this issue comment helped, combined with this explanation). I increased the maximum oldspace on node, and although the leak persists, my CI pipeline seems to be doing better/passing. Here my package.json input:"test-pipeline": "node --max-old-space-size=4096 ./node_modules/.bin/jest --runInBand --forceExit --logHeapUsage --bail",What else I tried and scraped together from a few other issues:
node --expose-gc ./node_modules/...) && used theafterEach(did nothing)For those reading along at home, this went out in 24.8.0.
I’ve observed today two unexplained behaviours:
--forceExitor--detectOpenHandles(or a combination of both), the memory usage drops from 1.4GB to roughly 300MBI don’t know if this is specific to our codebase or if the memory leak issue is tied to tests that somehow don’t really finish/cleanup properly (a “bug” that detectOpenHandles or forceExit somehow fix)
Same here, my CI crashes all time
After updating to 24.6.0, we are seeing the similar issue running our CI tests. When logging the heap usage, we see an increase of memory usage after each test file.
I wonder, why isn’t it possible for Jest to spawn a process for each test file, which will guarantee that memory will be freed? Ok, it can be slower, of course, but in my case - it’s much better to be slower rather than get a crash from out-of-memory and be blocked to use Jest alltogether…
Maybe an option? Or a separate “runner” (not sure if I understand architecture and terminology right)?
Is it architecturally possible?
Or, will Node-experimental-workers solve it?..
It seems there is a suggested fix/workaround for
Jestas per this comment: https://bugs.chromium.org/p/v8/issues/detail?id=12198#c20Hopefully this makes more sense to someone in the Jest team … is this something that could be persued? It seems the first suggestion is for
nodeitself but forjestthey are asking if it’s possible to remove forced GCs. I gotta admit I don’t know the detail.I used the above scenario to create a case where the heap increase is more noticable:
and
(
28.0.0-alpha.6)Each test is just
I also noticed that adding the extra
describe()makes the heap grow faster:--runInBand: 620 MB peak with and 500 MB peak withoutI can’t really say, based on the reproduction. I do see an increase test over test on the heap, but it’s completely linear and not the saw-tooth pattern I see on production repositories, so I think node just doesn’t run GC.
But I did find that running a single test file with a lot of tests seems to still leak:
I had a heap size of 313 mb with that (w/
--runInBand).Running the test with 1 million iterations yields a heap size of 2.6 GB. Beware that testing that takes a while (276 seconds).
Edit: Okay, this particular kind of leak seems to happen without --runInBand too.
Having same issue with ts-jest, the graceful-fs tip didn’t work for me
Is there any progress on this ? I still encouter this problem even with the most simple test suites (with and without ts-jest)
@unional if you’re on Circle, make sure
maxWorkersisn’t higher than the CPU allotted you by Circle.EDIT: To be clear, you should proactively specify
maxWorkersat or below the CPU allotted you Circle.From a preliminary run or two, it looks to me like going back to 16.10 is resolving these errors for us as well. Is there any more clarity on why this is, or what a real fix might look like?
Wow - this one got us too … after scouring the internet and finding this … reverting to
16.10fixed our build too (in gitlab, docker image extendingnode:16changed tonode:16.10). Here’s hoping there’s a longer-term solution, but many thanks for the suggestion!Bingo. This seems to be the fix alone with making sure to mock any external dependency that maybe no be your DB. In my case I was using a stats lib and bugsnag. When using the createMockFromModule it seems to actually run the file regardless so I ended up just mocking both along with running using
NODE_OPTIONS=--max-old-space-size=6144 NODE_ENV=test && node --expose-gc ./node_modules/.bin/jest -i --detectOpenHandles --logHeapUsage --no-cache@fazouane-marouane thanks so much… this one comment has legit saved the day.
For the record I use ts-jest. Memory Leak is gone!
I noticed a significant difference in the heap size on OSX vs Docker Node image after exposing the node GC. While the heap kept around ~400MB on the OSX it still climbed to 1300MB in the Docker container. Without exposing the GC the difference is negligible. So there might be some difference in how the GC works on different platforms.
Definitely not, I’m also on OSX, and it happens left and right.
This should help: https://github.com/facebook/jest/pull/8282
Will be released soon.
My tests are also leaking massively on CI but the exact same setup locally doesn’t really leak (much at least).
It’s so bad, I’m considering disabling tests on CI until I can make sense of what the difference is beside the OS. ):
Bueller?
I found this out recently but you can use the Chrome console to debug Node scripts! You can try using the Chrome console to profile Jest while it’s running to try and dig into the issue.
I believe the command is:
node --inspect ./node_modules/.bin/jest --watch -i. When running, open Chrome and go toabout:inspect. You should then see the running Node script.All the info on the regression that specifically affects node >= 16.11 is found in this issue: https://github.com/facebook/jest/issues/11956
Same issue for me. Downgrading to node 16.10 fixed the memory leak with Jest. I was seeing 3.4GB heap sizes with node 16.14, down to ~400MB with node 16.10.
Same issue here. For me, it seems that the problem is in the setupFilesAfterEnv script.
It’s better with node 16.10, but it still arrives at 841 MB heap size (580 tests)
I use Jest for integration testing, it can be complicated to find the source of the memory leak (maybe related to a graceful teardown problem in my test suite, not a Jest issue).
I use this workaround to avoid OOM using matrix on Github actions.
This script could be improved to upload each LCOV result in a final job and then merge all coverage results into one using
nyc mergesee: https://stackoverflow.com/questions/62560224/jest-how-to-merge-coverage-reports-from-different-jest-test-runsYou need
nock.restore();inafterAll, sonockis self-removing fromnode:http, otherwise it will activate again and againeg: nock > nock > nock > nock > node:http
https://github.com/renovatebot/renovate/blob/394f0bb7416ff6031bf7eb14498a85f00a6305df/test/http-mock.ts#L106-L121
I went trough the pull requests in your repo but can you give some more information on this? I have been having issues with large heap memory and flaky tests in CI only and I use nock. Any help is appreciated.
This is currently the way I manage nock in tests:
I have a very similar report: https://github.com/jakutis/ava-vs-jest/blob/master/issue/README.md
TLDR: jest uses at least 2 times more memory than ava for same tests (jsdom/node)
I have Jest 24.8.0 and #8282 doesn’t seem to help. Also
--runInBandonly helps a bit (4 GB instead of 10 GB 😮).Pleaaaaaaase fix this …
How soon? )':