rbperf: [bug?] Stacks for syscall traces don't seem to make sense
I was hoping to use rbperf to figure out where our remaining calls to getpid are coming from (ref https://github.com/rails/rails/issues/47418)
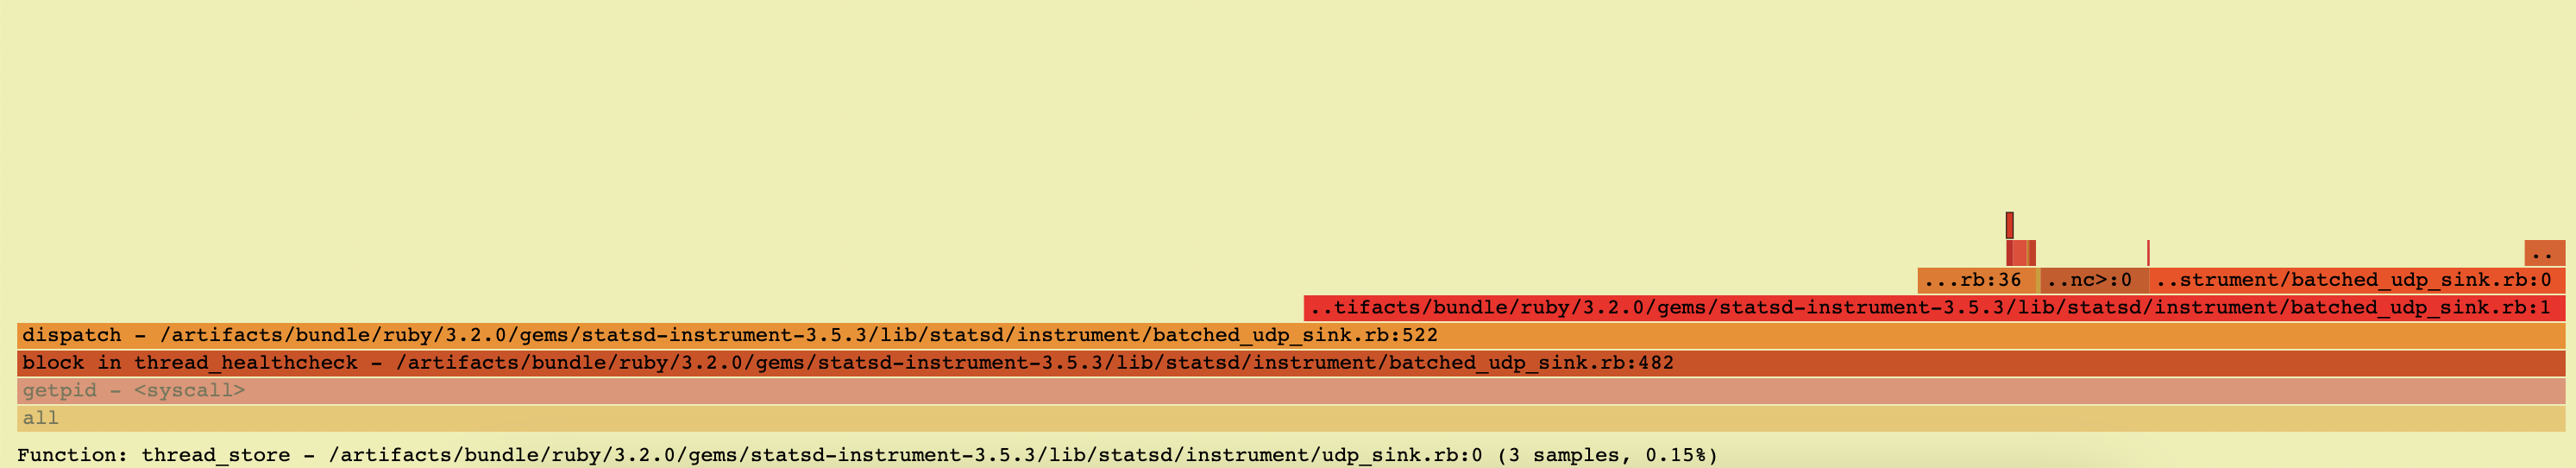
With the latest patches etc from #61 we are able to get some stack traces, but I don’t think they are accurate:
This is from an open source repo, so we can look at the code and see that it doesn’t look like Process.pid is being called from anywhere here:
https://github.com/Shopify/statsd-instrument/blob/master/lib/statsd/instrument/udp_sink.rb#L69
Also one of the wide bars here says it is in dispatch on line 522, but this file doesn’t have 522 lines https://github.com/Shopify/statsd-instrument/blob/v3.5.3/lib/statsd/instrument/batched_udp_sink.rb (it has 183 lines).
I wonder if how rbperf collects stacks on syscalls is actually accurate?
I assume it is connecting a BPF probe to a tracepoint for entering/exiting the syscall, then it goes and grabs the ruby stack.
Could it be that it is grabbing the wrong thread somehow?
This is for a Unicorn worker, not Puma, but there are still some background threads happening. This batched udp sink is one of our top background threads, so I wonder if it is somehow being charged for another stack’s getpid usage, just because it happens to be on CPU when the sample is taken?
About this issue
- Original URL
- State: closed
- Created a year ago
- Comments: 27 (11 by maintainers)
@dalehamel I’ve been thinking about this over the weekend, this is the brain dump of how I am debugging this and the current state of things. I will add some of these strategies as docs later this week.
I started with the assumption of a bug in
rbperf:bpf_signalto stop the process execution (see code below), and verified that in GDB I saw the exact same unexpected stack. This seemed to be correct.ruby_current_ecis more correct, as it should have the currently executing execution context. Using it is a bit trickier than other variables, as it’s a thread-local variable. Luckily I started looking into these for a different feature, and patchedrbperfto read the TLS variable, but the profiles still show the unexpected stack. This patch is still needed so will publish it later on (so far it only works with statically linked “librubies”).At this point, I was a bit confused. If we are reading the current execution context but the profile is still showing calls to
getpideven in this tiny reproducer, perhaps it’s worth tracing the native code callinggetpid?Another thread is calling
getpid()at times: https://github.com/ruby/ruby/blob/0aa50a03b1ea8d37069ae57c469f43860abbcf05/thread_pthread.c#L1984Seems like perhaps a useful feature here would be to gather the native stack trace in addition to Ruby’s. This is something I have thought of adding in the past, but as you are aware is pretty complicated to get right for everyone: e.g. symbols being present, ideally, we would only have to support Ruby+extensions compiled with frame pointers, etc.
Just to summarise, the broken stacks were caused due to:
ruby_current_ec, which is the current ec, for this, we’ll have to read TLS variables;getpid();Hope this makes sense, let me know what you think!
SIGSTOP on an unexpected stack
I don’t think this is a bug in rbperf itself, but rather was a nuance of ruby’s internal usage of syscalls. Closing.
Sorry for the delay, I was on holiday the past few days and didn’t check my computer. Will reply to everything in ~3 days
@javierhonduco great debugging on this - i hadn’t considered that the ruby VM itself could be part of the culprit calling
getpid👍Good points on the native frames - they would be very useful to grab if we could. I know you have some very interesting work in Parca that is able to load the necessary information from DWARF into a BPF map to do the native unwinding during the BPF handler. Perhaps we could do something similar if:
debuginfodservice andPerhaps before starting profiling, rbperf could walk the ruby memory map and collect build ids, to give the BPF code a shot at doing native unwinding. If it isn’t able to, perhaps it can fallback to frame pointer-based unwinding, or simply just show the top frame and indicate the stack is truncated.
I’m thinking aloud here, but really the issue is ensuring the callchain is accurate - we can symbolize after the fact as long as we have the callchains and the necessary mapping info, as I’m sure you know.
Forgot to mention that this would explain why there’s no
<native code>frame abovex, as their native frame is only inserted for natively implemented functions that are exposed in the runtime, rather than any other interpreter’s functions that aren’tAlso changed the reproducer to:
to confirm that the profile is correct with the WIP TLS changes.
Thanks for clarifying Jean, yes, we should see the call happen only once.
Anyways, I’ll try and whip up a test program today that shows the issue of it collecting the wrong thread’s stacks.
Any but the first one in a process. We only cache after the first call, and reset the cache after fork. So the very first
getpid()you see for a given process is likely to be a false positive.Thanks so much for all the context, this is very useful. The profiles should always be correct, even in multithreaded applications, so this is definitely a bug
Yeah interesting, I wonder if this is guaranteed to be accurate when a syscall happens, I’ll check with some ruby folks that are smarter than me, thanks!