vscode-dvc: Experiments webview stuck on loading experiments
Version
v0.1.0-04f53f6f23acb3faa29955d2a34a9b79aaceae32
Description
I’m using the dvc-get-started repo.

To reproduce:
https://www.dropbox.com/s/p6m89jpw196oqsy/repo.tgz?dl=0
Please give it a try - to use this exact repo (it has even .env in it). If not I would try create .env again.
Also, dvc exp show works perfectly.
About this issue
- Original URL
- State: closed
- Created 3 years ago
- Comments: 18 (18 by maintainers)
I confirm - it works for me now.
Looks like it’s fixed now! Thanks @rogermparent @mattseddon .
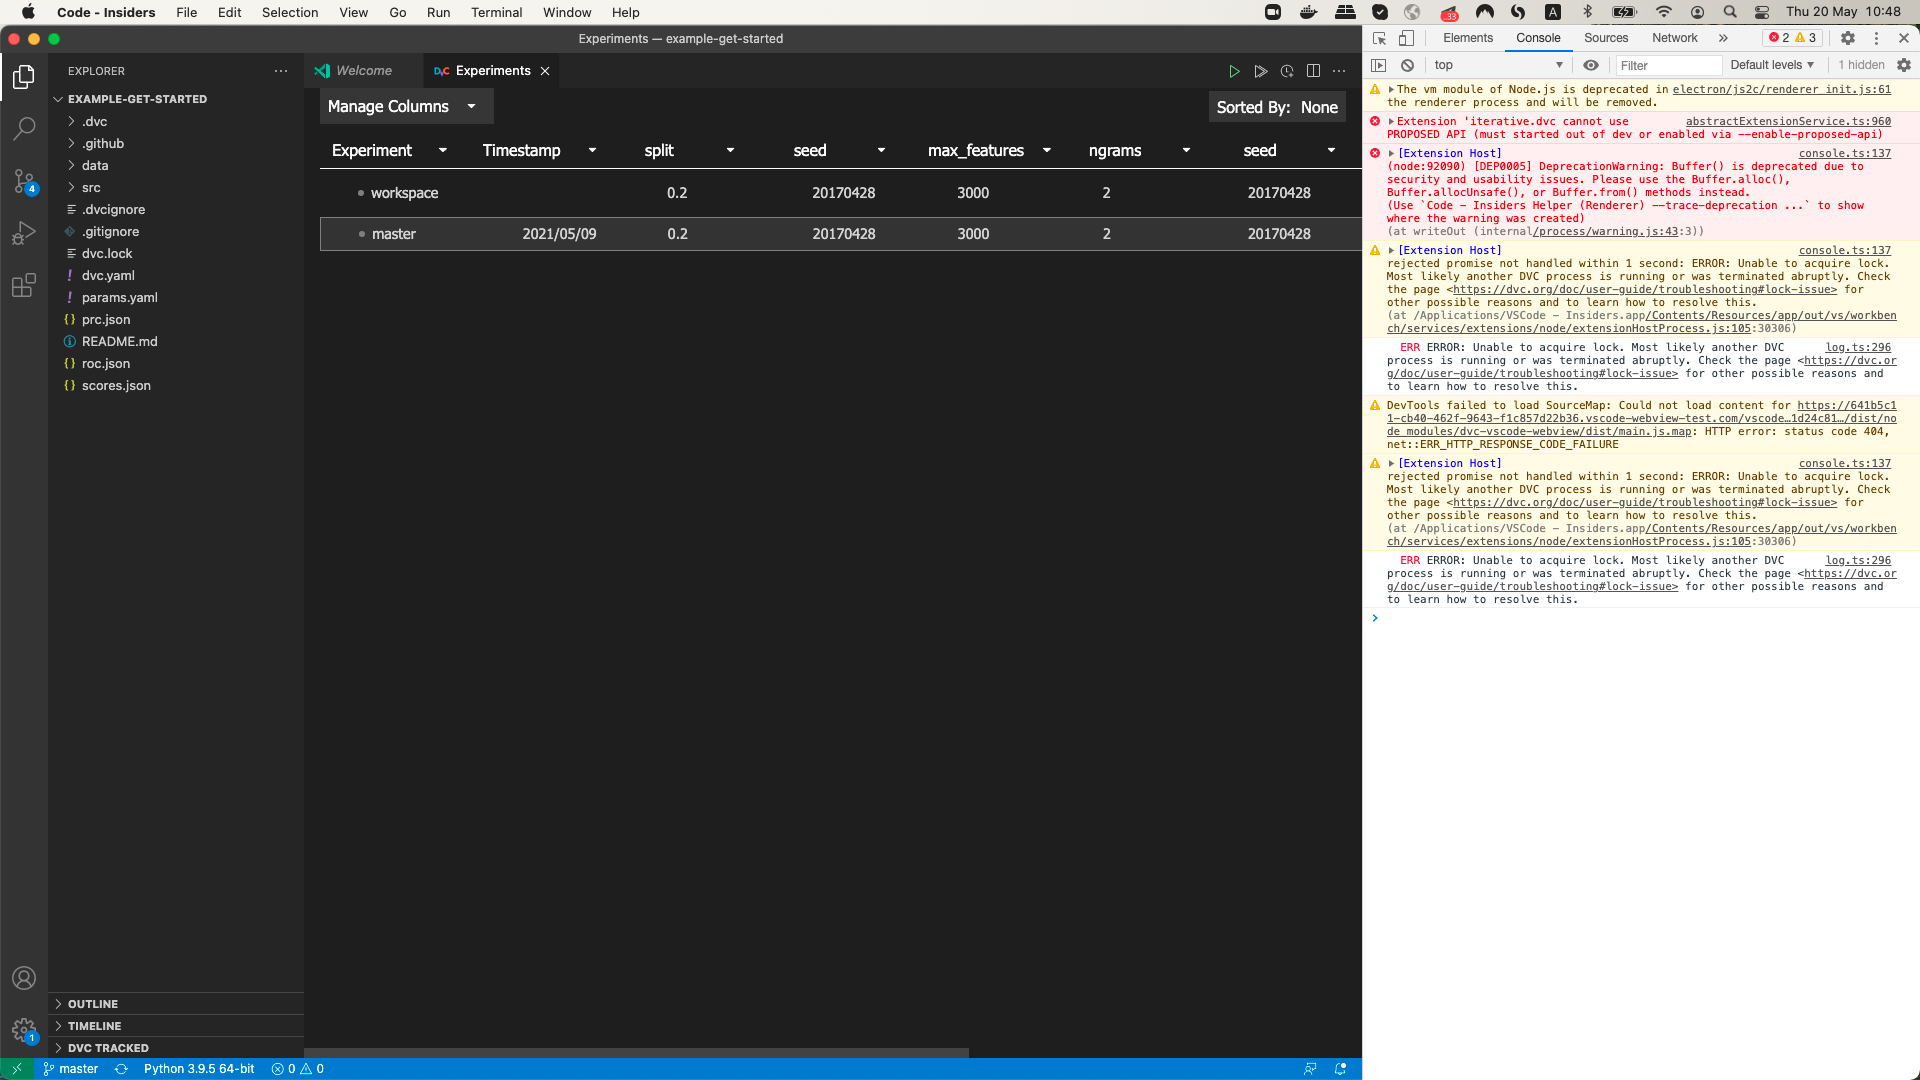
Now I’m confused, at some moment I was able to open experiments view for example-get-started, but can’t reproduce this again. Surprisingly, log messages were present:
Also I’m not sure why “seed” columns was repeated twice. It looks like a bug.
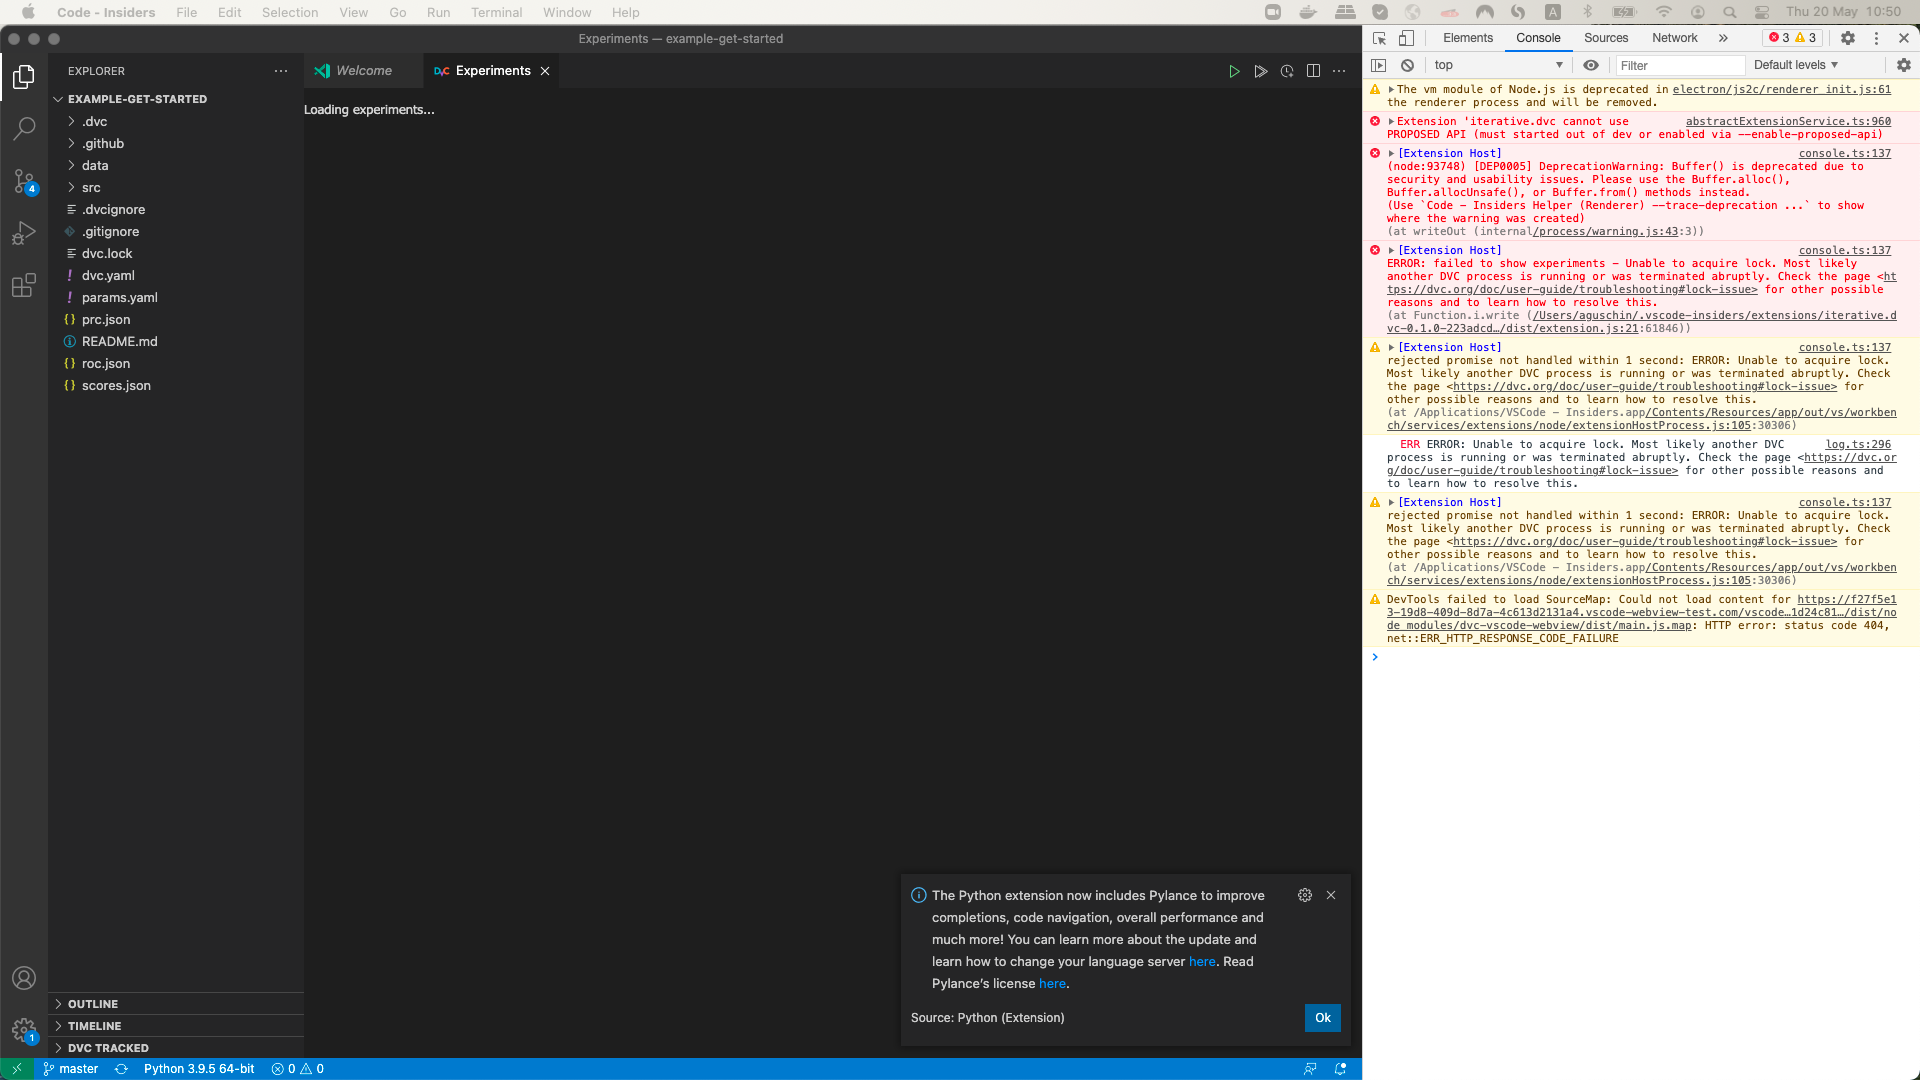
I’ve hit the same issue. I tried two repos - a project of mine with dvc and example-get-started. Interesting, that the issue only appears with example-get-started. I cloned the repo to have no changes there, the open VSCode with the extension, and then see (among other errors):
I’ve tried resolutions suggested in the link above (first: remove

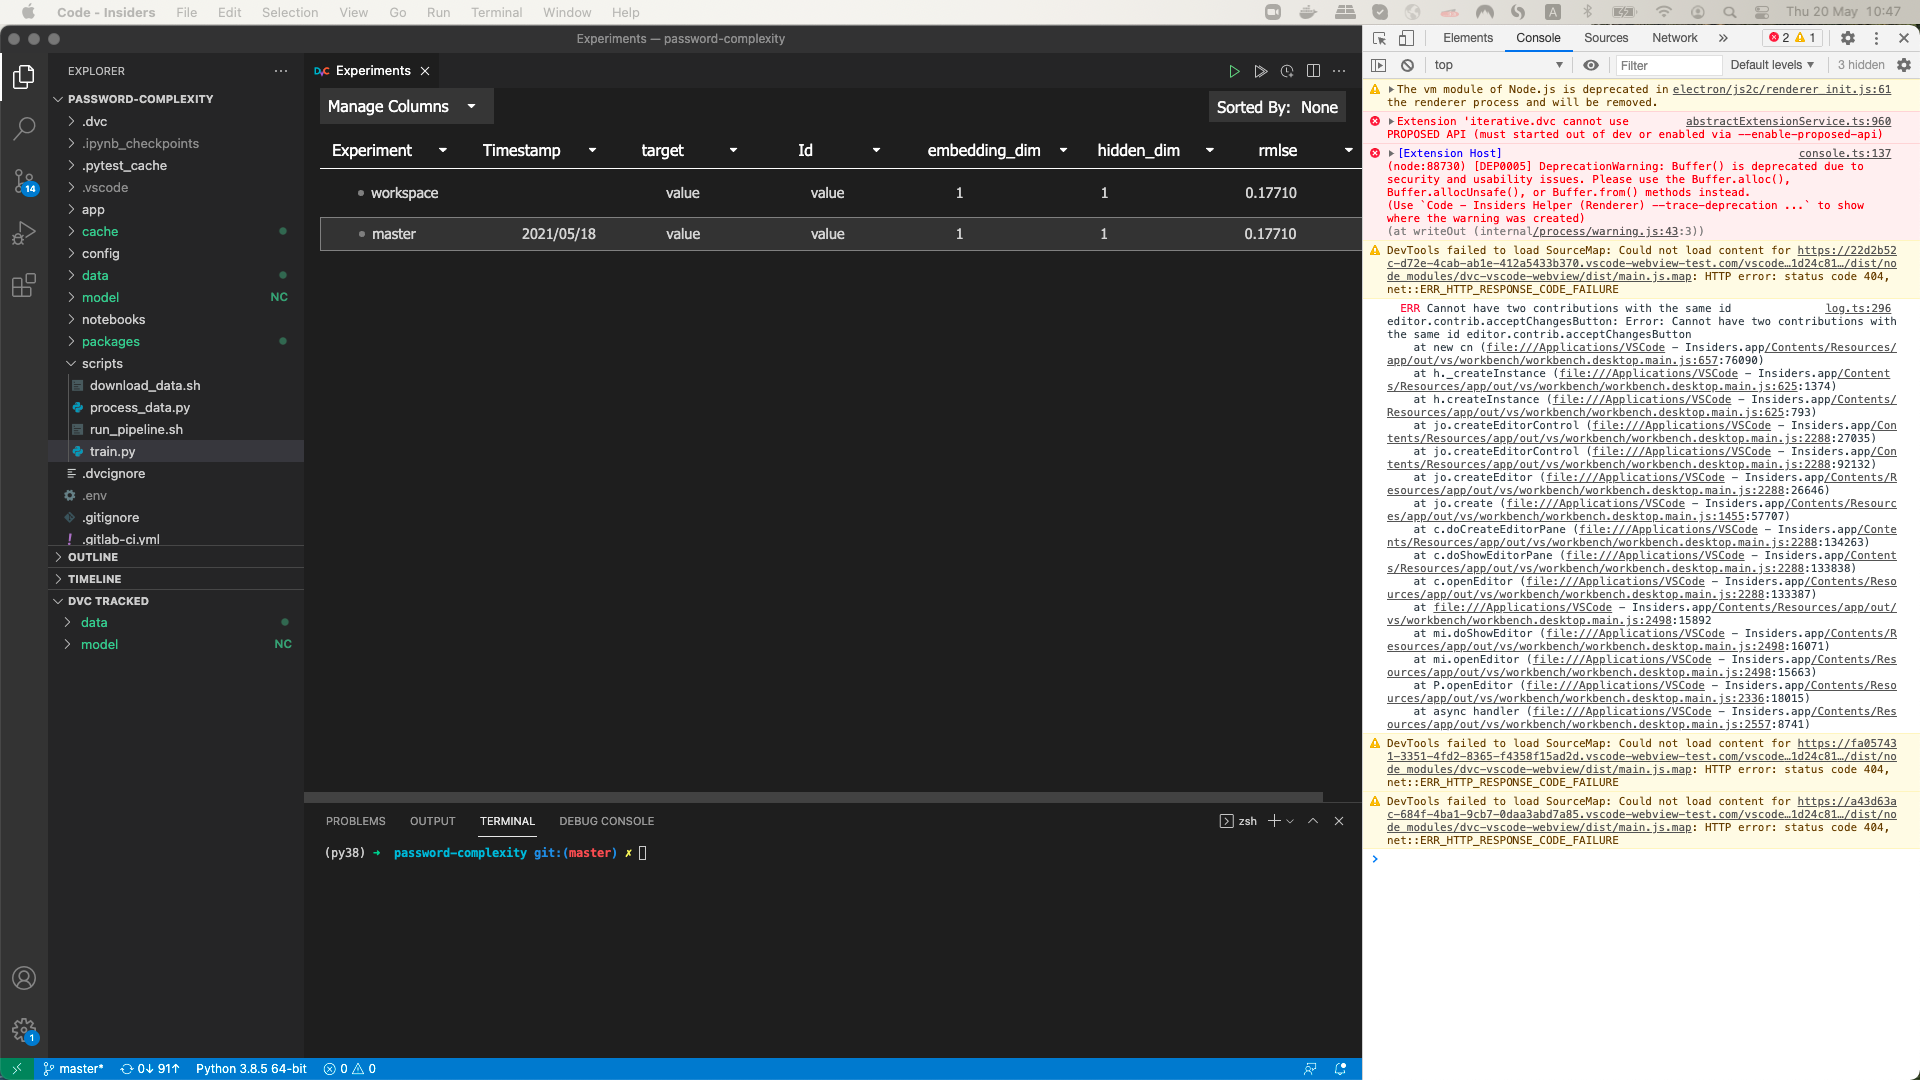
.dvc/tmp/lock, second: rundvc config core.hardlink_lock true), but none work. What I found out, that the.dvc/tmp/lockfile is refreshing every time I click on VScode (even with experiments webview closed). This also happens on the first repo I mentioned, where experiments are shown correctly. Not sure, what is the difference. The logs in Developer Tools are different, so I just provide both of them in case there is something interesting.Yep, I think we are on the page. My question is about application level logging and being able to set some flag - DEBUG=true, run it an see the logs. Something like “Running dvc exp show” … “Exp show returned …”
This issue that we have also means that we need to rethink a bit how do we change the page behavior. Probably we want to explain to users what is happening under the hood. I think we can create a Story out of this.
What’s going on with my repo - I don’t know yet … will keep looking into this
@rogermparent is there a way to enable logs for the VSIX build so that we can debug/see what is happening? Are there some best practices in terms of logging for extensions?
for me
dvc exp showalone works fine@rogermparent haha, no worries 😃 but this is the first thing I would try - “reset your machine” Windows © 😃