telegraf: clustername tag value missing after upgrading to 1.15.1
Relevant telegraf.conf:
# Host & VM stats
[[inputs.vsphere]]
   interval = "60s"
   ## List of vCenter URLs to be monitored. These three lines must be uncommented
   ## and edited for the plugin to work.
   vcenters = [ "https://FQDN/sdk" ]
   username = "username"
   password = "hunter2"

   force_discover_on_init = true

   ## VMs
   ## Typical VM metrics (if omitted or empty, all metrics are collected)
   vm_metric_include = [
     "cpu.demand.average",
     "cpu.idle.summation",
     "cpu.latency.average",
     "cpu.readiness.average",
     "cpu.ready.summation",
     "cpu.run.summation",
     "cpu.usage.average",
     "cpu.usagemhz.average",
     "cpu.used.summation",
     "cpu.wait.summation",
     "mem.active.average",
     "mem.granted.average",
     "mem.latency.average",
     "mem.swapin.average",
     "mem.swapinRate.average",
     "mem.swapout.average",
     "mem.swapoutRate.average",
     "mem.usage.average",
     "mem.vmmemctl.average",
     "net.bytesRx.average",
     "net.bytesTx.average",
     "net.droppedRx.summation",
     "net.droppedTx.summation",
     "net.usage.average",
     "power.power.average",
     "virtualDisk.numberReadAveraged.average",
     "virtualDisk.numberWriteAveraged.average",
     "virtualDisk.read.average",
     "virtualDisk.readOIO.latest",
     "virtualDisk.throughput.usage.average",
     "virtualDisk.totalReadLatency.average",
     "virtualDisk.totalWriteLatency.average",
     "virtualDisk.write.average",
     "virtualDisk.writeOIO.latest",
     "sys.uptime.latest",
   ]
   # vm_metric_exclude = [] ## Nothing is excluded by default
   vm_instances = true ## true by default

   ## Hosts
   ## Typical host metrics (if omitted or empty, all metrics are collected)
   host_metric_include = [
     "cpu.coreUtilization.average",
     "cpu.costop.summation",
     "cpu.demand.average",
     "cpu.idle.summation",
     "cpu.latency.average",
     "cpu.readiness.average",
     "cpu.ready.summation",
     "cpu.swapwait.summation",
     "cpu.usage.average",
     "cpu.usagemhz.average",
     "cpu.used.summation",
     "cpu.utilization.average",
     "cpu.wait.summation",
     "disk.deviceReadLatency.average",
     "disk.deviceWriteLatency.average",
     "disk.kernelReadLatency.average",
     "disk.kernelWriteLatency.average",
     "disk.numberReadAveraged.average",
     "disk.numberWriteAveraged.average",
     "disk.read.average",
     "disk.totalReadLatency.average",
     "disk.totalWriteLatency.average",
     "disk.write.average",
     "mem.active.average",
     "mem.latency.average",
     "mem.state.latest",
     "mem.swapin.average",
     "mem.swapinRate.average",
     "mem.swapout.average",
     "mem.swapoutRate.average",
     "mem.totalCapacity.average",
     "mem.usage.average",
     "mem.vmmemctl.average",
     "net.bytesRx.average",
     "net.bytesTx.average",
     "net.droppedRx.summation",
     "net.droppedTx.summation",
     "net.errorsRx.summation",
     "net.errorsTx.summation",
     "net.usage.average",
     "power.power.average",
     "storageAdapter.numberReadAveraged.average",
     "storageAdapter.numberWriteAveraged.average",
     "storageAdapter.read.average",
     "storageAdapter.write.average",
     "sys.uptime.latest",
   ]
   # host_metric_exclude = [] ## Nothing excluded by default
   host_instances = true ## true by default

   ## Clusters
   # cluster_metric_include = [] ## if omitted or empty, all metrics are collected
   cluster_metric_exclude = ["*"] ## Nothing excluded by default
   # cluster_instances = true ## true by default

   ## Datastores
   # datastore_metric_include = [] ## if omitted or empty, all metrics are collected
   datastore_metric_exclude = ["*"] ## Nothing excluded by default
   # datastore_instances = true ## false by default for Datastores only

   ## Datacenters
   # datacenter_metric_include = [] ## if omitted or empty, all metrics are collected
   datacenter_metric_exclude = ["*"] ## Datacenters are not collected by default.
   # datacenter_instances = true ## false by default for Datastores only

   ## Plugin Settings
   ## separator character to use for measurement and field names (default: "_")
   # separator = "_"

   ## number of objects to retreive per query for realtime resources (vms and hosts)
   ## set to 64 for vCenter 5.5 and 6.0 (default: 256)
   # max_query_objects = 256

   ## number of metrics to retreive per query for non-realtime resources (clusters and datastores)
   ## set to 64 for vCenter 5.5 and 6.0 (default: 256)
   # max_query_metrics = 256

   ## number of go routines to use for collection and discovery of objects and metrics
   # collect_concurrency = 1
   # discover_concurrency = 1

   ## whether or not to force discovery of new objects on initial gather call before collecting metrics
   ## when true for large environments this may cause errors for time elapsed while collecting metrics
   ## when false (default) the first collection cycle may result in no or limited metrics while objects are discovered
   # force_discover_on_init = false

   ## the interval before (re)discovering objects subject to metrics collection (default: 300s)
   # object_discovery_interval = "300s"

   ## timeout applies to any of the api request made to vcenter
   timeout = "100s"

   ## Optional SSL Config
   # ssl_ca = "/path/to/cafile"
   # ssl_cert = "/path/to/certfile"
   # ssl_key = "/path/to/keyfile"
   ## Use SSL but skip chain & host verification
   insecure_skip_verify = true

   use_int_samples = false

# Datastores
[[inputs.vsphere]]
   interval = "300s"
   ## List of vCenter URLs to be monitored. These three lines must be uncommented
   ## and edited for the plugin to work.
   vcenters = [ "https://FQDN/sdk" ]
   username = "username"
   password = "hunter2"

   force_discover_on_init = true

   ## VMs
   vm_metric_exclude = ["*"] ## Nothing is excluded by default
   # vm_instances = true ## true by default

   ## Hosts
   host_metric_exclude = ["*"] ## Nothing excluded by default
   # host_instances = true ## true by default

   ## Clusters
   # cluster_metric_include = [] ## if omitted or empty, all metrics are collected
   # cluster_metric_exclude = ["*"] ## Nothing excluded by default
   cluster_instances = true ## true by default

   ## Datastores
   # datastore_metric_include = [] ## if omitted or empty, all metrics are collected
   # datastore_metric_exclude = [] ## Nothing excluded by default
   datastore_instances = true ## false by default for Datastores only

   ## Datacenters
   # datacenter_metric_include = [] ## if omitted or empty, all metrics are collected
   # datacenter_metric_exclude = [ "*" ] ## Datacenters are not collected by default.
   datacenter_instances = true ## false by default for Datastores only

   ## Plugin Settings
   ## separator character to use for measurement and field names (default: "_")
   # separator = "_"

   ## number of objects to retreive per query for realtime resources (vms and hosts)
   ## set to 64 for vCenter 5.5 and 6.0 (default: 256)
   # max_query_objects = 256

   ## number of metrics to retreive per query for non-realtime resources (clusters and datastores)
   ## set to 64 for vCenter 5.5 and 6.0 (default: 256)
   # max_query_metrics = 256

   ## number of go routines to use for collection and discovery of objects and metrics
   # collect_concurrency = 1
   # discover_concurrency = 1

   ## whether or not to force discovery of new objects on initial gather call before collecting metrics
   ## when true for large environments this may cause errors for time elapsed while collecting metrics
   ## when false (default) the first collection cycle may result in no or limited metrics while objects are discovered
   # force_discover_on_init = false

   ## the interval before (re)discovering objects subject to metrics collection (default: 300s)
   # object_discovery_interval = "300s"

   ## timeout applies to any of the api request made to vcenter
   timeout = "240s"

   ## Optional SSL Config
   # ssl_ca = "/path/to/cafile"
   # ssl_cert = "/path/to/certfile"
   # ssl_key = "/path/to/keyfile"
   ## Use SSL but skip chain & host verification
   insecure_skip_verify = true

   use_int_samples = false
System info:
Telegraf: 1.15.1 OS: Debian 10.4 (Buster) vCenter: 6.7
Steps to reproduce:
- Configure the vSphere input
- Wait for metrics to be fetched
Expected behavior:
Various datapoints have a tag called “clustername”, this tag should contain the (human readable) name of the cluster where the VM for example resides in.
Actual behavior:
The value in the “clustername” tag is gone.
Additional info:
Query output:
> SELECT * FROM "vsphere_vm_cpu" WHERE ("vmname" =~ /^vmhostname$/) AND time >= now() - 2h fill(null)
name: vsphere_vm_cpu
time                clustername             cpu            dcname demand_average    esxhostname           guest      guesthostname host                   idle_summation     latency_average    moid      readiness_average  ready_summation    run_summation      source                 usage_average     usagemhz_average   used_summation     uuid                                 vcenter                  vmname                 wait_summation
----                -----------             ---            ------ --------------    -----------           -----      ------------- ----                   --------------     ---------------    ----      -----------------  ---------------    -------------      ------                 -------------     ----------------   --------------     ----                                 -------                  ------                 --------------

BEFORE

1595485260000000000 cluster-name 0              dcname                    esxi-host OS vmname     vmhostname 9667                                  vm-157768 1.65               331.5              9945.5             vmhostname                   1633.5             10893              421c5eb8-fd6f-fb7d-76d9-cff967e93801 vcenter-hostname vmhostname 9715
1595485260000000000 cluster-name 1              dcname                    esxi-host OS vmname     vmhostname 9853.5                                vm-157768 1.595              319.5              9807               vmhostname                   1611               10745.5            421c5eb8-fd6f-fb7d-76d9-cff967e93801 vcenter-hostname vmhostname 9872

AFTER

1595487660000000000                         0              dcname                    esxi-host OS vmname     vmhostname 8826.5                                vm-157768 1.78               356                9699.5             vmhostname                   1593               10650.5            421c5eb8-fd6f-fb7d-76d9-cff967e93801 vcenter-hostname vmhostname 9723
1595487660000000000                         2              dcname                    esxi-host OS vmname     vmhostname 8845.5                                vm-157768 1.96               395                9376               vmhostname                   1546               10249.5            421c5eb8-fd6f-fb7d-76d9-cff967e93801 vcenter-hostname vmhostname 10037.5
The ‘before’ version is v1.14.5.
About this issue
- Original URL
- State: closed
- Created 4 years ago
- Comments: 29 (13 by maintainers)
I’m hoping to get to this today or during the weekend.
Hello, I have created the VMware Dashboards and I can confirm that after the latest update, I was on 1.14.3 without any issues, the cluster metrics are not being collected as they were. I have received already so many emails, comments, and tweets around these issues. What exactly do you want me to test with this version?
Sorry, I can not think of any simple way other than looking at telegraf log first, you will see something like this, bear the cluster giving you metrics: 2021-01-13T00:29:01Z D! [inputs.vsphere] Query for cluster returned metrics for 3 objects 2021-01-13T00:29:01Z D! [inputs.vsphere] CollectChunk for cluster returned 18 metrics 2021-01-13T00:29:01Z D! [inputs.vsphere] CollectChunk for cluster returned 18 metrics 2021-01-13T00:29:01Z D! [inputs.vsphere] Query for cluster has 1 QuerySpecs 2021-01-13T00:29:01Z D! [inputs.vsphere] Query for cluster returned metrics for 1 objects 2021-01-13T00:29:01Z D! [inputs.vsphere] CollectChunk for cluster returned 18 metrics 2021-01-13T00:29:01Z D! [inputs.vsphere] CollectChunk for cluster returned 18 metrics 2021-01-13T00:29:01Z D! [inputs.vsphere] Query for cluster has 1 QuerySpecs 2021-01-13T00:29:01Z D! [inputs.vsphere] Query for datacenter returned metrics for 1 objects 2021-01-13T00:29:01Z D! [inputs.vsphere] CollectChunk for datacenter returned 60 metrics 2021-01-13T00:29:01Z D! [inputs.vsphere] CollectChunk for datacenter returned 60 metrics 2021-01-13T00:29:01Z D! [inputs.vsphere] Latest sample for datacenter set to 2021-01-13 00:25:00 +0000 UTC 2021-01-13T00:29:01Z D! [inputs.vsphere] Query for cluster returned metrics for 1 objects 2021-01-13T00:29:01Z D! [inputs.vsphere] CollectChunk for cluster returned 30 metrics 2021-01-13T00:29:01Z D! [inputs.vsphere] CollectChunk for cluster returned 30 metrics 2021-01-13T00:29:01Z D! [inputs.vsphere] Query for cluster has 1 QuerySpecs 2021-01-13T00:29:01Z D! [inputs.vsphere] Query for cluster returned metrics for 1 objects 2021-01-13T00:29:01Z D! [inputs.vsphere] CollectChunk for cluster returned 21 metrics 2021-01-13T00:29:01Z D! [inputs.vsphere] CollectChunk for cluster returned 21 metrics
And then suddenly going to Grafana to check something from the cluster, like this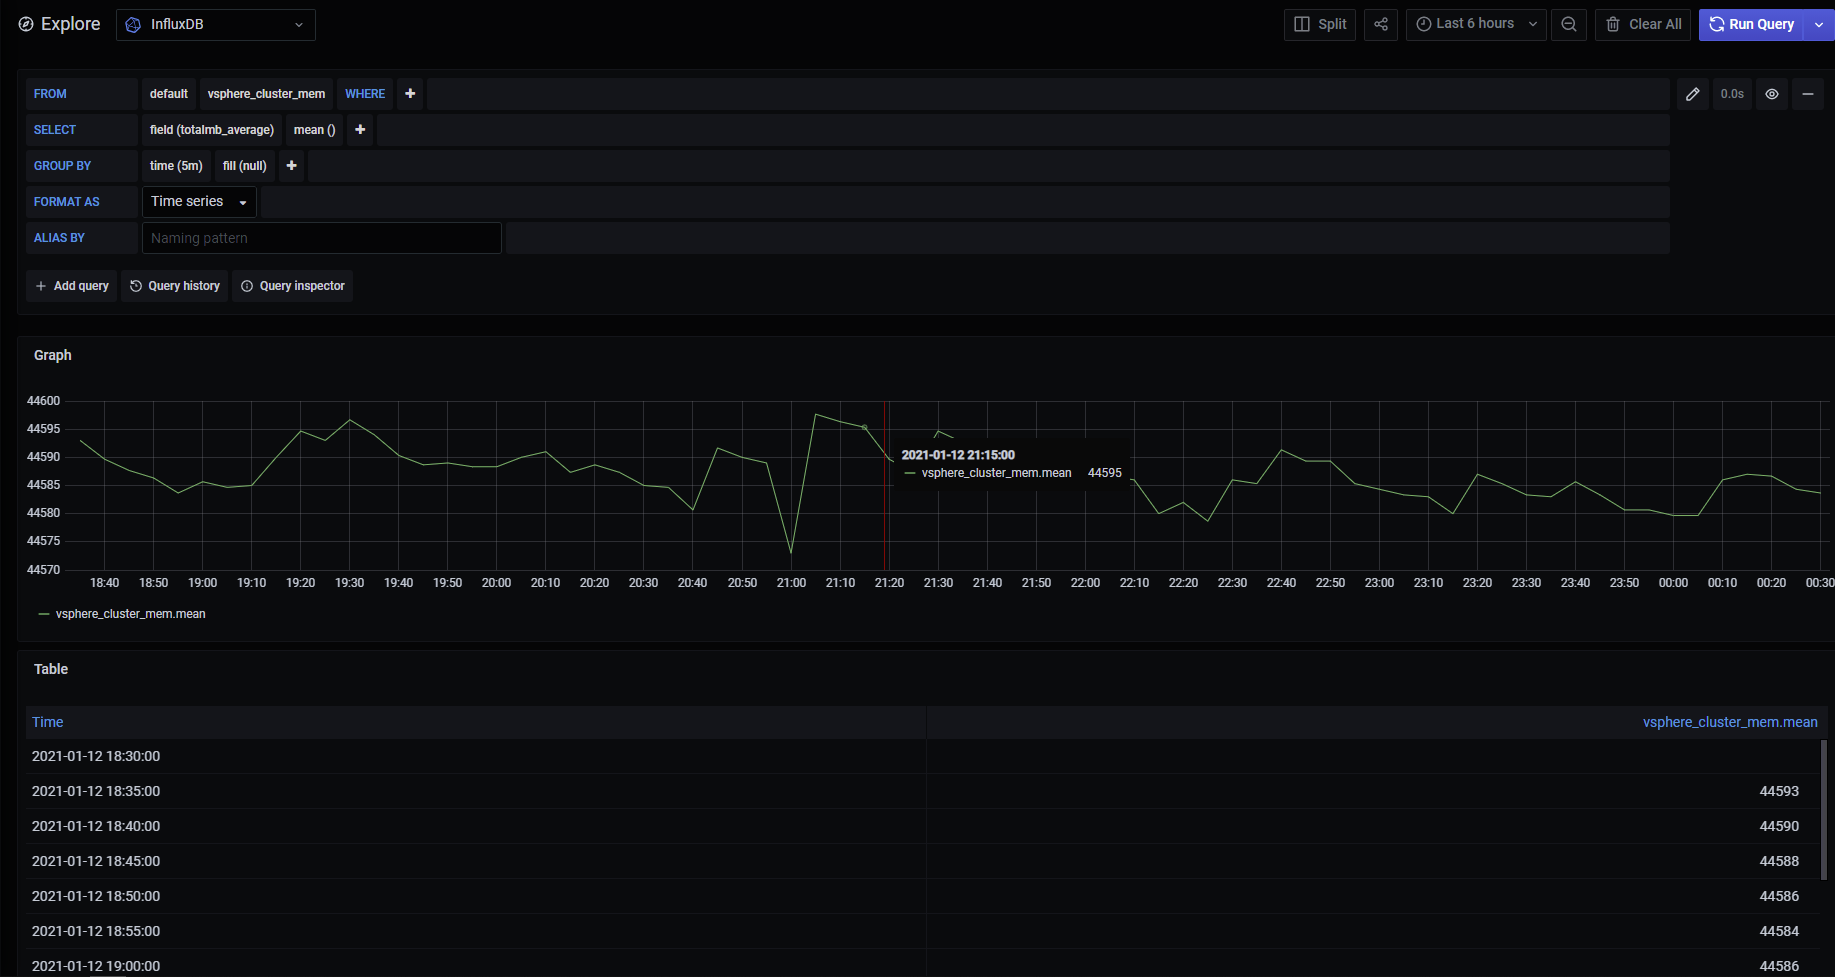
I found and fixed the bug. I would love some help testing it. The pre-release of the fix can be found here: https://github.com/wavefrontHQ/telegraf/releases/tag/1.15.2-clusterfix
It would be awesome if someone could run it in their environment. My preliminary testing shows that it works well.