influxdb: InfluxDB 2 bug: record is missing label timeRangeStart/timeRangeStop
General background about the setup:
- There is an MQTT network sending IoT data to a raspberry Pi
- Raspberry pi runs a python script to upload data to influxdb (in real time)
- Currently uploading data every 3s
- Each upload is a list of lines, each line being measurement/tag_set/field_set/timestamp format
- Upload method is by using python paho mqtt, and line protocol
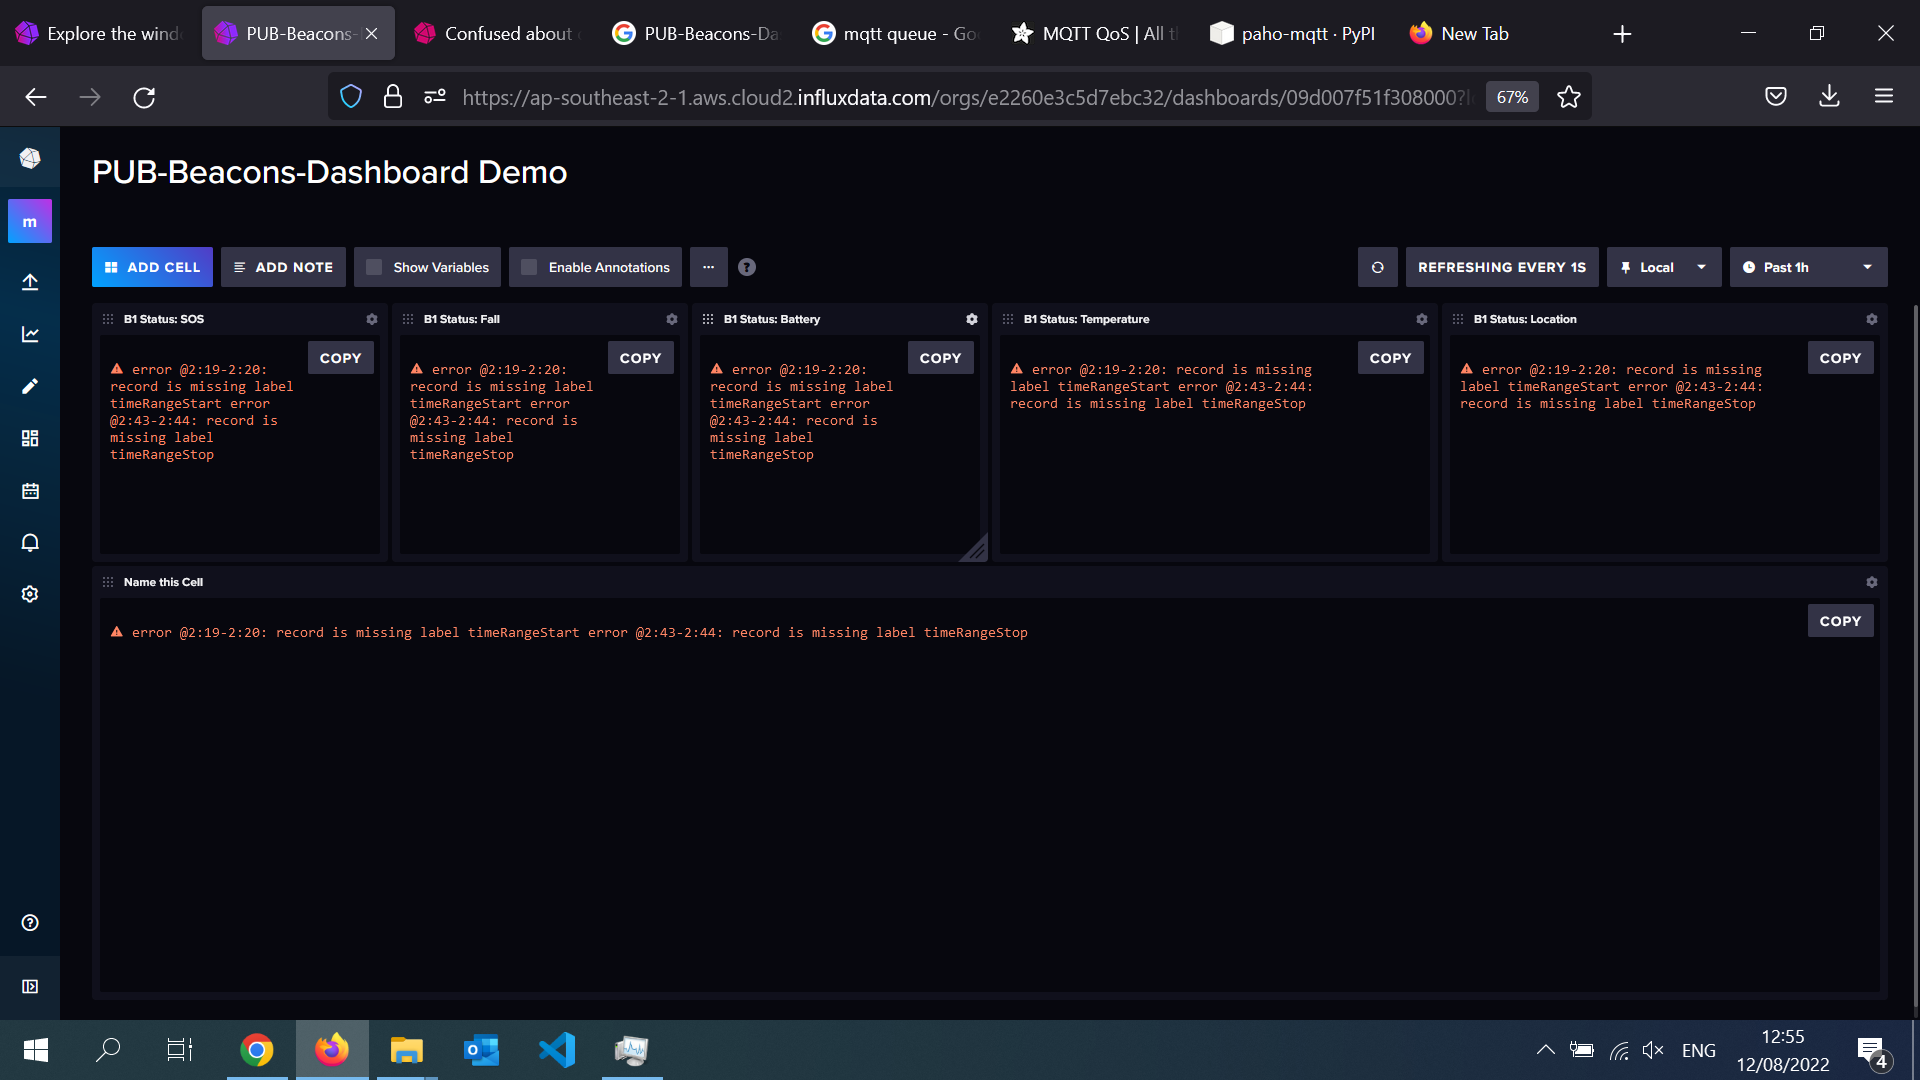
Essentially, this setup now works, data is at the database, and it is being visualized in a dashboard. However, when the dashboard is running and displaying real-time sensor data, it works for a bit and then shows these errors. Every time. After the crash, when I go inside a widget, I cannot submit a new query and cannot see any raw data anymore… It’s like a timerangestart and timerangestop data goes missing… The dashboard works once again after the page is refreshed. So I am really confused on why that happens, what caused it, and how to fix it.
Note: I now realize that refreshing every 1s gives this error in a couple of minutes, refreshing every 5s gives the error within ~20 minutes, refreshing every 10s gives the error within less than an hour… It’s almost as if some limit is reached, and refreshing the page is the temporary fix. While refreshing the page is a good temporary solution to display data, I cannot keep refreshing this page every few minute when it breaks, at the moment this dashboard looks unstable and unreliable.
Please refer to the screenshots to better understand the issue:
-
Working at 12:54 12/08/2022 https://ibb.co/XZYNwbm
-
Crashed at 12:55 12/08/2022 https://ibb.co/1sDyVMr
Please recommend how to fix this 😄
Steps to reproduce: List the minimal actions needed to reproduce the behavior.
- Send IoT data to InfluxDB every 3s, via Python
- Create a dashboard on InfluxDB
- Set dashboard auto-refresh to refresh every 1s
- All the widgets displaying data break within minutes
Expected behavior: Dashboard updates and displays current data
Actual behavior: All widgets display the error message: error @2:19-2:20: record is missing label timeRangeStart error @2:43-2:44: record is missing label timeRangeStop
Flux sample code:
from(bucket: "windows-test")
  |> range(start: v.timeRangeStart, stop: v.timeRangeStop)
  |> filter(fn: (r) => r["_measurement"] == "B1")
  |> filter(fn: (r) => r["_field"] == "RSSI")
  |> filter(fn: (r) => r["gatewayID"] == "2224750077" or r["gatewayID"] == "2224766301" or r["gatewayID"] == "2224822273")
  |> aggregateWindow(every: v.windowPeriod, fn: mean, createEmpty: false)
  |> yield(name: "mean")
About this issue
- Original URL
- State: closed
- Created 2 years ago
- Reactions: 3
- Comments: 22 (3 by maintainers)
We have identified the Dashboard stability issue and rolled the UI back to a more stable version in the recent 2.6.0 release. Due to the number of issues related to this, I’m going to close all of these issues as Completed. Please open a new issue if you are still seeing the Dashboard stability problems on 2.6.0.
I think I have a scenario to reproduce this bug.