consul-template: High CPU Utilization
Hello Hashicorp friends!
Over at GitHub, we are using consul-template to drive some of our edge and internal load balancing tier. Recently, we have been seeing the consul-template process alternating between consuming a 150% CPU and 10-30% CPU. It looks something like this, which is a graph of consul-template CPU utilization per host for that particular load balancing tier:
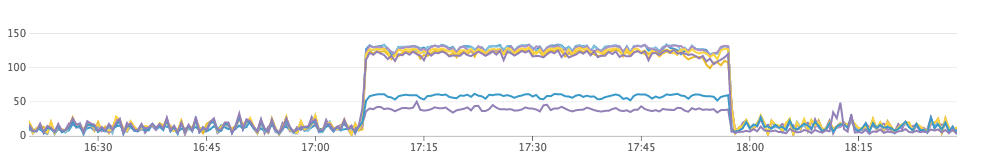
From ☝️, it’s clear that the distribution of CPU utilization is bimodal during periods of 📈 high CPU utilization. We have multiple separate templates and one consul-template process running per host in dedup mode.
Here’s what we have learned:
- 📈 During CPU spikes, the template leaders are spread out across multiple hosts
- 📈 During CPU spikes, The higher CPU tier are consumers of deduplicated templates and the lower CPU tier are the template leaders.
- 📉 During the low CPU periods, the template leaders are consolidated all on the same host
To clarify, we have 10 templates: When all 10 template leaders are consolidated to the same consul-template process, CPU utilization is low 📉. During the spikes above, 2 leaders were on one host, and 6 on another and the CPU utilization was high 📈. We can reproduce this by stopping all consul-template processes and bringing them back up serially. It also happens naturally sometimes when we deploy new template files.
During the 📈 high-CPU periods, the template leaders are regenerating and writing to the dedup key several times per second every wait interval. This causes the dedup consumers to deserialize the template from consul sometimes hundreds of times. TCP dumps on both side validate that the rate of GETs (consumers) and PUTs (leaders) to the consul-template/$md5/dedup keys is dramatically different when the template leaders are consolidated vs not. The spikes of dedup writes to Consul align with the wait interval for each template (e.g. a template with a wait interval of 30s will see a spike of writes every 30s, followed by a few seconds of waiting). tcpdumps from during the CPU spikes 📈 nearly identically resemble https://github.com/hashicorp/consul-template/issues/677#issuecomment-236547098.
As an example, from the logs on one of the 2 leaders at the time (which held leadership for 8 templates) during a 📈 CPU spike.
$ sudo awk '/2018-04-18T14:2.*updated de-duplicate/ {print $1 }' /var/log/consul-template.log  | sort | uniq -c
...
      2 2018-04-18T14:28:01-07:00   <-----
     17 2018-04-18T14:28:02-07:00
     17 2018-04-18T14:28:03-07:00
     17 2018-04-18T14:28:04-07:00
     16 2018-04-18T14:28:05-07:00
     17 2018-04-18T14:28:06-07:00
     18 2018-04-18T14:28:07-07:00
     15 2018-04-18T14:28:08-07:00
     15 2018-04-18T14:28:09-07:00
     15 2018-04-18T14:28:10-07:00
     15 2018-04-18T14:28:11-07:00
     18 2018-04-18T14:28:12-07:00
     14 2018-04-18T14:28:13-07:00
      2 2018-04-18T14:28:31-07:00   <------
     16 2018-04-18T14:28:32-07:00
     17 2018-04-18T14:28:33-07:00
     18 2018-04-18T14:28:34-07:00
     17 2018-04-18T14:28:35-07:00
     18 2018-04-18T14:28:36-07:00
     18 2018-04-18T14:28:37-07:00
     20 2018-04-18T14:28:38-07:00
     17 2018-04-18T14:28:39-07:00
     18 2018-04-18T14:28:40-07:00
     18 2018-04-18T14:28:41-07:00
     18 2018-04-18T14:28:42-07:00
      1 2018-04-18T14:28:43-07:00
      1 2018-04-18T14:29:01-07:00  <-----
     17 2018-04-18T14:29:02-07:00
     18 2018-04-18T14:29:03-07:00
     17 2018-04-18T14:29:04-07:00
     19 2018-04-18T14:29:05-07:00
     18 2018-04-18T14:29:06-07:00
     16 2018-04-18T14:29:07-07:00
     18 2018-04-18T14:29:08-07:00
     19 2018-04-18T14:29:09-07:00
     19 2018-04-18T14:29:10-07:00
     17 2018-04-18T14:29:11-07:00
     19 2018-04-18T14:29:12-07:00
      2 2018-04-18T14:29:31-07:00   <------
     18 2018-04-18T14:29:32-07:00
     20 2018-04-18T14:29:33-07:00
     19 2018-04-18T14:29:34-07:00
     19 2018-04-18T14:29:35-07:00
     18 2018-04-18T14:29:36-07:00
     19 2018-04-18T14:29:37-07:00
     20 2018-04-18T14:29:38-07:00
     19 2018-04-18T14:29:39-07:00
     19 2018-04-18T14:29:40-07:00
     18 2018-04-18T14:29:41-07:00
      9 2018-04-18T14:29:42-07:00
During low periods, the writes are far less frequent and CPU is “reasonable” everywhere.
I have not yet been able to reproduce this in an isolated environment & we haven’t yet had a chance to enable debug logging (which would be…bountiful), but I wanted to get this issue open with the data we have to see if this rang any 🔔 for you fine folks at Hashicorp.
For reference, our environment:
- consul-template v0.19.4 (68b1da2)
- Consul v0.7.2
- OS: Debian Jessie w/ 4.9 backport kernel
Our base consul-template config (which is supplemented with per-template config)
{
    "consul": {
        "address": "127.0.0.1:8500",
        "retry": {
            "backoff": "1s"
        }
    },
    "deduplicate": {
        "enabled": true
    },
    "log_level": "info",
    "syslog": {
        "enabled": true
    }
}
The per-template configs are all basically the same & look roughly like:
    {
      "command": "****",
      "source": "****",
      "destination": "****",
      "wait": {
        "min": "30s"
      }
    }
Happy to help dig into this and try things. There are several templates of varying complexity, so copypasta of all of that might be tricky.
Thanks!
About this issue
- Original URL
- State: closed
- Created 6 years ago
- Reactions: 5
- Comments: 17 (9 by maintainers)
Thanks for the detailed report and repro @aaronbbrown, that is truly awesome. We just talked about this within the Consul team and will plan to take a look at what you provided as part of our current release cycle. We may reach out to you for more info, thanks!
For benefit of people watching, I spent today looking at this issue. I can easily reproduce it thanks to @aaronbbrown’s awesome docker-compose repro case however I’ve not yet pinpointed the actual cause of the high CPU usage during rapid lock churn.
In the process of trying to tease apart the craziness going on here I discovered #1099 which is a fairly large inefficiency/bug with de-dupe already although on it’s own doesn’t explain the busy loop, just the reason so much activity is going on constantly even when the template output isn’t changing in the de-dupe case.
Will keep digging.
We’ve made it a couple weeks without a recurrence now. I’m comfortable with calling this one. I don’t appear to have the ability to close the issue. @pearkes @banks feel free to do so if you all are happy with this.
@bjanusch-int it’s on our TODO list for this week or next hopefully - just juggling a few priorities as always 😄.
Yeah. Just wanted to check in. We noticed we were getting a lot of log spam due to this which is what prompted me to check on the status. We’ll look at dropping it as a stop-gap.
@aaronbbrown so my fix (#1100) for #1099 seems to fix this for me locally.
At least with that branch built as a docker image locally your repro case no longer consumes wild CPU.
I’ve verified that the leadershp is split between many of the templates and still the CPU remains “normal” for my docker VM vs. burning all the cores I assigned it before.
I’m a reluctant to declare that all is perfect in this de-dupe locking code but my hypothesis is this is what caused the pathalogical case you hit:
UpdateDepsLOOP:UpdateDepsmiscalculate the hash of the dependency values and decide it needs to re-render the template it’s leader forRun: https://github.com/hashicorp/consul-template/blob/d0ee7a7a959b1106932665677d8259974907741e/manager/runner.go#L378runTemplatewhich ends up callingr.dedupe.UpdateDeps: https://github.com/hashicorp/consul-template/blob/d0ee7a7a959b1106932665677d8259974907741e/manager/runner.go#L722-L727UpdateDepsmiscalculates hash…goto: LOOP@aaronbbrown if you are able to validate my branch in #1100 in some environment I’d love to hear if this fixes things for you too.
I’m going to work on getting that merged and a release out ASAP although we have a few other priorities in the next week and some travel to juggle.