nodejs-firestore: HUGE memory leak problem
Environment details
- OS: Mac OS 10.15 Beta (19A573a)
- Node.js version: v12.10.0
- npm version: 6.10.3
@google-cloud/firestoreversion: 2.3.0
I’m still experiencing a memory leak potentially related to #661. The following is from my yarn.lock:
"@grpc/grpc-js@^0.5.2":
  version "0.5.2"
  resolved "https://registry.yarnpkg.com/@grpc/grpc-js/-/grpc-js-0.5.2.tgz#8e39876033749e1611fe9fa181d9535077805abe"
  integrity sha512-NE1tP/1AF6BqhLdILElnF7aOBfoky+4ZOdZU/0NmKo2d+9F9QD8zGoElpBk/5BfyQZ3u1Zs+wFbDOFpVUzDx1w==
  dependencies:
    semver "^6.0.0"

"@grpc/proto-loader@^0.5.0", "@grpc/proto-loader@^0.5.1":
  version "0.5.1"
  resolved "https://registry.yarnpkg.com/@grpc/proto-loader/-/proto-loader-0.5.1.tgz#48492b53cdda353110b51a4b02f465974729c76f"
  integrity sha512-3y0FhacYAwWvyXshH18eDkUI40wT/uGio7MAegzY8lO5+wVsc19+1A7T0pPptae4kl7bdITL+0cHpnAPmryBjQ==
  dependencies:
    lodash.camelcase "^4.3.0"
    protobufjs "^6.8.6"
Quick note: because of the grpc problems that keep appearing here, we should probably put grpc version as part of the issue template
So it is clear that I’m actually using the “correct” grpc. My application makes many calls to firestore and I’m experiencing massive memory leaks.

I’m not actually seeing the error message described previously (MaxListenersExceededWarning), however, the memory usage on my application slowly and steady is increasing. I’ve taken several heap snapshots from local tests over the course of several hours and when comparing snapshots from a few hours apart, I notice that the top culprits for memory allocations are all related to grpc.
Here you can clearly see that the top 4 culprits for the memory delta between snapshots 12 and 4 are vastly more than everything else

Here are the contents of each from largest to smallest:
-
(string): This by far is the fastest growing constructor. As you can see, there are 920k new allocations in the comparison between the two snapshots. Practically every single string here is
""(function anonymous( ) { return function BeginTransactionRequest(p){ if(p)for(var ks=Object.keys(p),i=0;i<ks.length;++i)if(p[ks[i]]!=null) this[ks[i]]=p[ks[i]] } })". And this all comes frommessage.js:13. This is a a file from the packageprotobufjswhich is a dependency of grpc.
-
(system): Essentially everything here seems to be coming from from the same
message.js:13. I also have tens of thousands of objects that look like this (from grpc)

-
(array): Practically every single array allocation here is a alloc size 32 and is linked to
type.js:31andnamespace.js:95, both of which are also part of protobufjs. “Field” is also related to the same line numbers and is actually directly linked to grpc

-
Array: There are 235k of these and they all look the same - Array with an alloc size of 32 with some connection to grpc

About this issue
- Original URL
- State: closed
- Created 5 years ago
- Reactions: 9
- Comments: 74 (20 by maintainers)
Hi guys 👋 I believe I discovered a memory and network socket leak that might possibly be a root cause of this issue, or at least one of the causes, in a
@grpc/grpc-jsdependency.I opened an issue with a reproduction, but I’d appreciate if you could validate that my reproduction yields the same results on your systems and that the reproduction steps are clear and easy to follow, so that gRPC team will be able to fix it more easily. Thanks in advance!
https://github.com/grpc/grpc-node/issues/1085
Version 3.0.0 should be released on Monday morning (Pacific time). With this version, we close the GRPC client when a channel becomes idle. If you request load frequently causes new channels to be spawn and released, this should reduce the memory burden described in this issue.
I am sorry and somewhat embarrassed by how long this took. I hope this solves the root issue described in here.
@schmidt-sebastian Any update on “next week” or did you have one of these weeks in mind https://www.mentalfloss.com/article/51370/why-our-calendars-skipped-11-days-1752
Similarly I was running into connection errors after ± an hour of the service running on 2.4.0
Being that this is a paid service, why can’t @google-cloud/firestore be released with the legacy grpc until this is resolved? I’m sure many people are experiencing this issue.
Any idea how soon firebase-admin-node will be upgraded from 2.6v to start using 3.0v of nodejs-firestore? @schmidt-sebastian I’m really glad a solution is in the pipe here, this has caused us a lot of grief, thank you for your efforts!
Is there any update on this? Bleeding cash for me.
There is clearly a problem with 2.4.0 This is a graph of memory usage on my application over the last several days. For the last week I had been using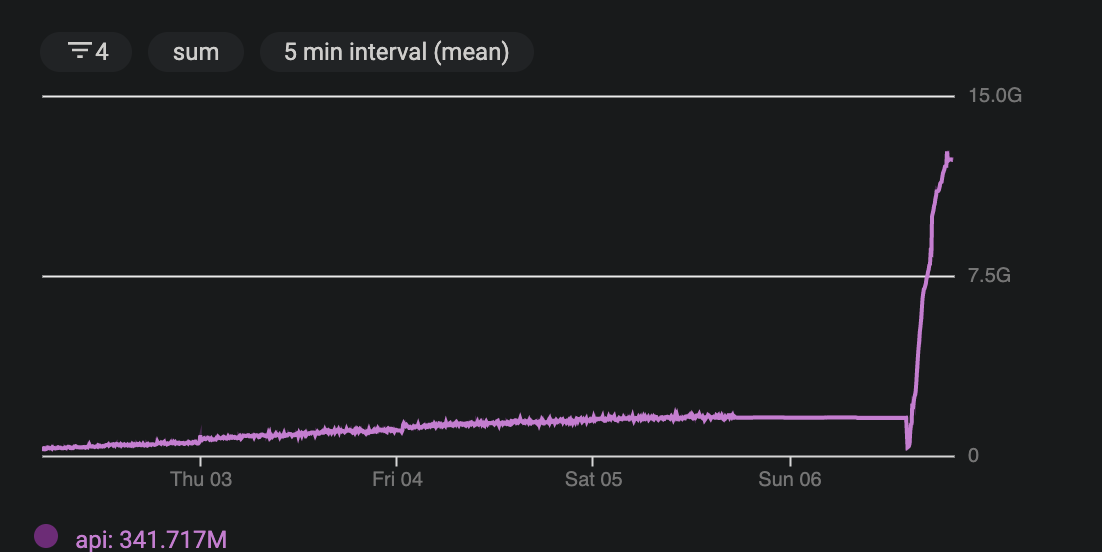 It was much better using the legacy constructor; however, it was still climbing. The part where you see it leveling off is when we cut off traffic to our application. So you can see the growth stopped but the memory persisted.
@google-cloud/firestore2.3.0 with the legacy grpc in the constructor. I tried switching to 2.4.0 without the legacy grpc constructor and my memory usage skyrocketed.@swftvsn @schmidt-sebastian why is firestore not using the binary method of grpc until the other version is stable? what’s to be gained? this memory leak cost me close to $1k on gcp and is now a bottleneck for launching my product. i’m sure i’m not the only one experiencing issues like this