go: runtime: scheduler is slow when goroutines are frequently woken
What version of Go are you using (go version)?
go1.7.3
What operating system and processor architecture are you using (go env)?
linux/amd64; Xeon E5-2670 (dual-socket 6-core packages, non-HT)
Our profiles indicate that we’re spending an enormous number of cycles in runtime.findrunnable (and its callees) on the hosts that serve as our protocol heads.
Briefly, our these hosts translate HTTP CRUD operations into sets of transactions to be performed on our storage hosts, so the only real I/O these hosts do is networking.
Here’s what I see in our cpu profiles when I run a benchmark with 40 clients against a single host backed by 60 storage controllers:
host 486938695e10692ab3a6a554cf47486b: 7356 samples
 top flat  pct symbol
1831 2030 24.9 syscall.Syscall
 900  900 12.2 i/c/siphash.blocks
 835  835 11.4 runtime.futex
 661  661  9.0 runtime.epollwait
 224  224  3.0 runtime.memmove
 180  297  2.4 runtime.runqgrab
 176 2584  2.4 runtime.findrunnable
 171  171  2.3 runtime/internal/atomic.Cas
 116  116  1.6 runtime/internal/atomic.Xchg
  85   85  1.2 runtime/internal/atomic.Load
-------------------------------------------------------------------------------------
host 486938695e10692ab3a6a554cf47486b
"runtime.findrunnable" -- in 2584 samples of 7356 (35.1%)
1 callers:
  in  flat symbol
2584 2694.0 runtime.schedule
21 callees:
 out  flat symbol
  67 130.0 runtime.unlock
  20 46.0 runtime/internal/atomic.Xadd
  14 85.0 runtime/internal/atomic.Load
 406 406.0 runtime.injectglist
 488 488.0 runtime.stopm
 331 331.0 runtime.runqsteal
 139 238.0 runtime.lock
  16 31.0 runtime/internal/atomic.Xchg64
  26 26.0 runtime.pidleput
   2  2.0 runtime.releasep
  59 66.0 runtime.runqempty
  21 161.0 runtime.casgstatus
 777 777.0 runtime.netpoll
   9  9.0 runtime/internal/atomic.Store64
   8  8.0 runtime.netpollinited
   2  8.0 runtime.acquirep
  10 15.0 runtime.pidleget
   8  8.0 runtime.globrunqget
   2 12.0 runtime.fastrand1
   2  2.0 runtime.nanotime
   1 10.0 runtime.runqget
… here’s the same benchmark, but this time against two hosts backed by (the same) 60 storage controllers:
host 91b42bdeee8bc69fe40c33dff7c146ac: 6563 samples
 top flat  pct symbol
1695 1829 25.8 syscall.Syscall
 977  977 14.9 i/c/siphash.blocks
 639  639  9.7 runtime.futex
 431  431  6.6 runtime.memmove
 373  373  5.7 runtime.epollwait
 155  221  2.4 runtime.runqgrab
 112 1756  1.7 runtime.findrunnable
 100  100  1.5 runtime/internal/atomic.Cas
  89   89  1.4 runtime/internal/atomic.Xchg
  83   83  1.3 runtime.usleep
--------------------------
host f8e02f9facaa304dce98c8d876270a10: 6540 samples
 top flat  pct symbol
1593 1716 24.4 syscall.Syscall
 895  895 13.7 i/c/siphash.blocks
 598  598  9.1 runtime.futex
 399  399  6.1 runtime.memmove
 385  385  5.9 runtime.epollwait
 130  130  2.0 runtime/internal/atomic.Cas
 128  233  2.0 runtime.runqgrab
 104 1763  1.6 runtime.findrunnable
 102  102  1.6 runtime.usleep
 101  101  1.5 runtime/internal/atomic.Xchg

host 91b42bdeee8bc69fe40c33dff7c146ac
"runtime.findrunnable" -- in 1756 samples of 6563 (26.8%)
1 callers:
  in  flat symbol
1756 1846.0 runtime.schedule
20 callees:
 out  flat symbol
  41 98.0 runtime.unlock
   5 53.0 runtime/internal/atomic.Load
  45 51.0 runtime.runqempty
  12 12.0 runtime/internal/atomic.Store64
   8 91.0 runtime.casgstatus
  15 49.0 runtime/internal/atomic.Xadd
 364 365.0 runtime.stopm
 443 443.0 runtime.netpoll
 108 172.0 runtime.lock
 295 295.0 runtime.injectglist
 246 246.0 runtime.runqsteal
   3  3.0 runtime.releasep
  30 30.0 runtime.pidleput
   8 16.0 runtime.pidleget
   4  4.0 runtime.netpollinited
   3 12.0 runtime.runqget
   9  9.0 runtime.globrunqget
   3 22.0 runtime/internal/atomic.Xchg64
   1  7.0 runtime.fastrand1
   1  1.0 runtime.nanotime
-----------------
host f8e02f9facaa304dce98c8d876270a10
1 callers:
  in  flat symbol
1763 1853.0 runtime.schedule
21 callees:
 out  flat symbol
 268 268.0 runtime.runqsteal
  24 24.0 runtime.pidleput
 477 477.0 runtime.netpoll
 109 167.0 runtime.lock
   4 12.0 runtime.acquirep
   6 58.0 runtime/internal/atomic.Load
   7  7.0 runtime/internal/atomic.Store64
 298 298.0 runtime.injectglist
  49 54.0 runtime.runqempty
  33 71.0 runtime.unlock
  11 117.0 runtime.casgstatus
 327 328.0 runtime.stopm
   5 12.0 runtime.pidleget
  10 10.0 runtime.globrunqget
   5  9.0 runtime.runqget
   7  7.0 runtime.netpollinited
  12 40.0 runtime/internal/atomic.Xadd
   1  7.0 runtime.fastrand1
   4 24.0 runtime/internal/atomic.Xchg64
   1  1.0 runtime.releasep
   1  1.0 runtime.nanotime
Interestingly, the single-head cpu consumption is at 560% of 1200%, and the dual-head cpu consumption is at 470% and 468% of 1200%, respectively.
A couple notable details:
- Performance is substantially worse in the single-host case (65% of the dual-host case), despite the fact that it is only half-loaded and backed by the same set of storage nodes running an identical front-end workload. I suppose some of this could be chalked up to head-of-line blocking, but I suspect there’s more going on. In principle I’d expect very little difference between the two configurations, since none of these requests need to synchronize.
- Proportionally more time (35% vs 27%) is spent in
runtime.findrunnablein the single-node case. I’d expect that system to have on average 2x the number of goroutines, but I didn’t think more goroutines would cause the proportional amount of time in the scheduler to increase. (I had presumed that more goroutines meant less work-stealing and polling, which would mean proportionally less time doing expensive stuff like syscalls and atomics.)
Let me know if there are other details I can provide.
Thanks, Phil
About this issue
- Original URL
- State: open
- Created 8 years ago
- Reactions: 5
- Comments: 37 (19 by maintainers)
Commits related to this issue
- runtime: don't attempt to steal from idle Ps Work stealing is a scalability bottleneck in the scheduler. Since each P has a work queue, work stealing must look at every P to determine if there is any... — committed to golang/go by prattmic 4 years ago
- runtime: try to elide timer stealing if P has no timers Following golang.org/cl/259578, findrunnable still must touch every other P in checkTimers in order to look for timers to steal. This scales po... — committed to golang/go by prattmic 4 years ago
- runtime: elide timer re-check if P has no timers In golang.org/cl/264477, I missed this new block after rebasing past golang.org/cl/232298. These fields must be zero if there are no timers. Updates ... — committed to golang/go by prattmic 4 years ago
- runtime: don't usleep() in runqgrab() The most recently goready()'d G on each P is given a special position in the P's runqueue, p.runnext. Other Ps steal p.runnext only as a last resort, and usleep(... — committed to nixprime/go by nixprime a year ago
- runtime: don't usleep() in runqgrab() The most recently goready()'d G on each P is given a special position in the P's runqueue, p.runnext. Other Ps steal p.runnext only as a last resort, and usleep(... — committed to nixprime/go by nixprime a year ago
I was able to capture a trace of the original issue @philhofer described and wanted to add the requested screenshots to verify that this is the scheduler worst case scenario described by @aclements.
Though the profiling samples nicely show the time being spent in
runtime.findrunnable, the trace viewer doesn’t make it quite as clear since the scheduling behavior has to be inferred from the white space. Here’s a couple of screenshots that roughly show the behavior of the socket getting serviced constantly, but no meaningful progress from the program’s perspective.From a macro view, here’s about 40ms total:
Most of the tiny slivers are network wake-ups to read an MTU off a particular socket, but not enough data to fill the desired buffer (think 1500 MTU but 64k desired buffers). The burst of longer operations on the right is processing that happened when enough data has been received to do higher level work with the data (Reed-Solomon computation in this case).
Next screenshot is a zoom in to the small goroutine section (~2ms total):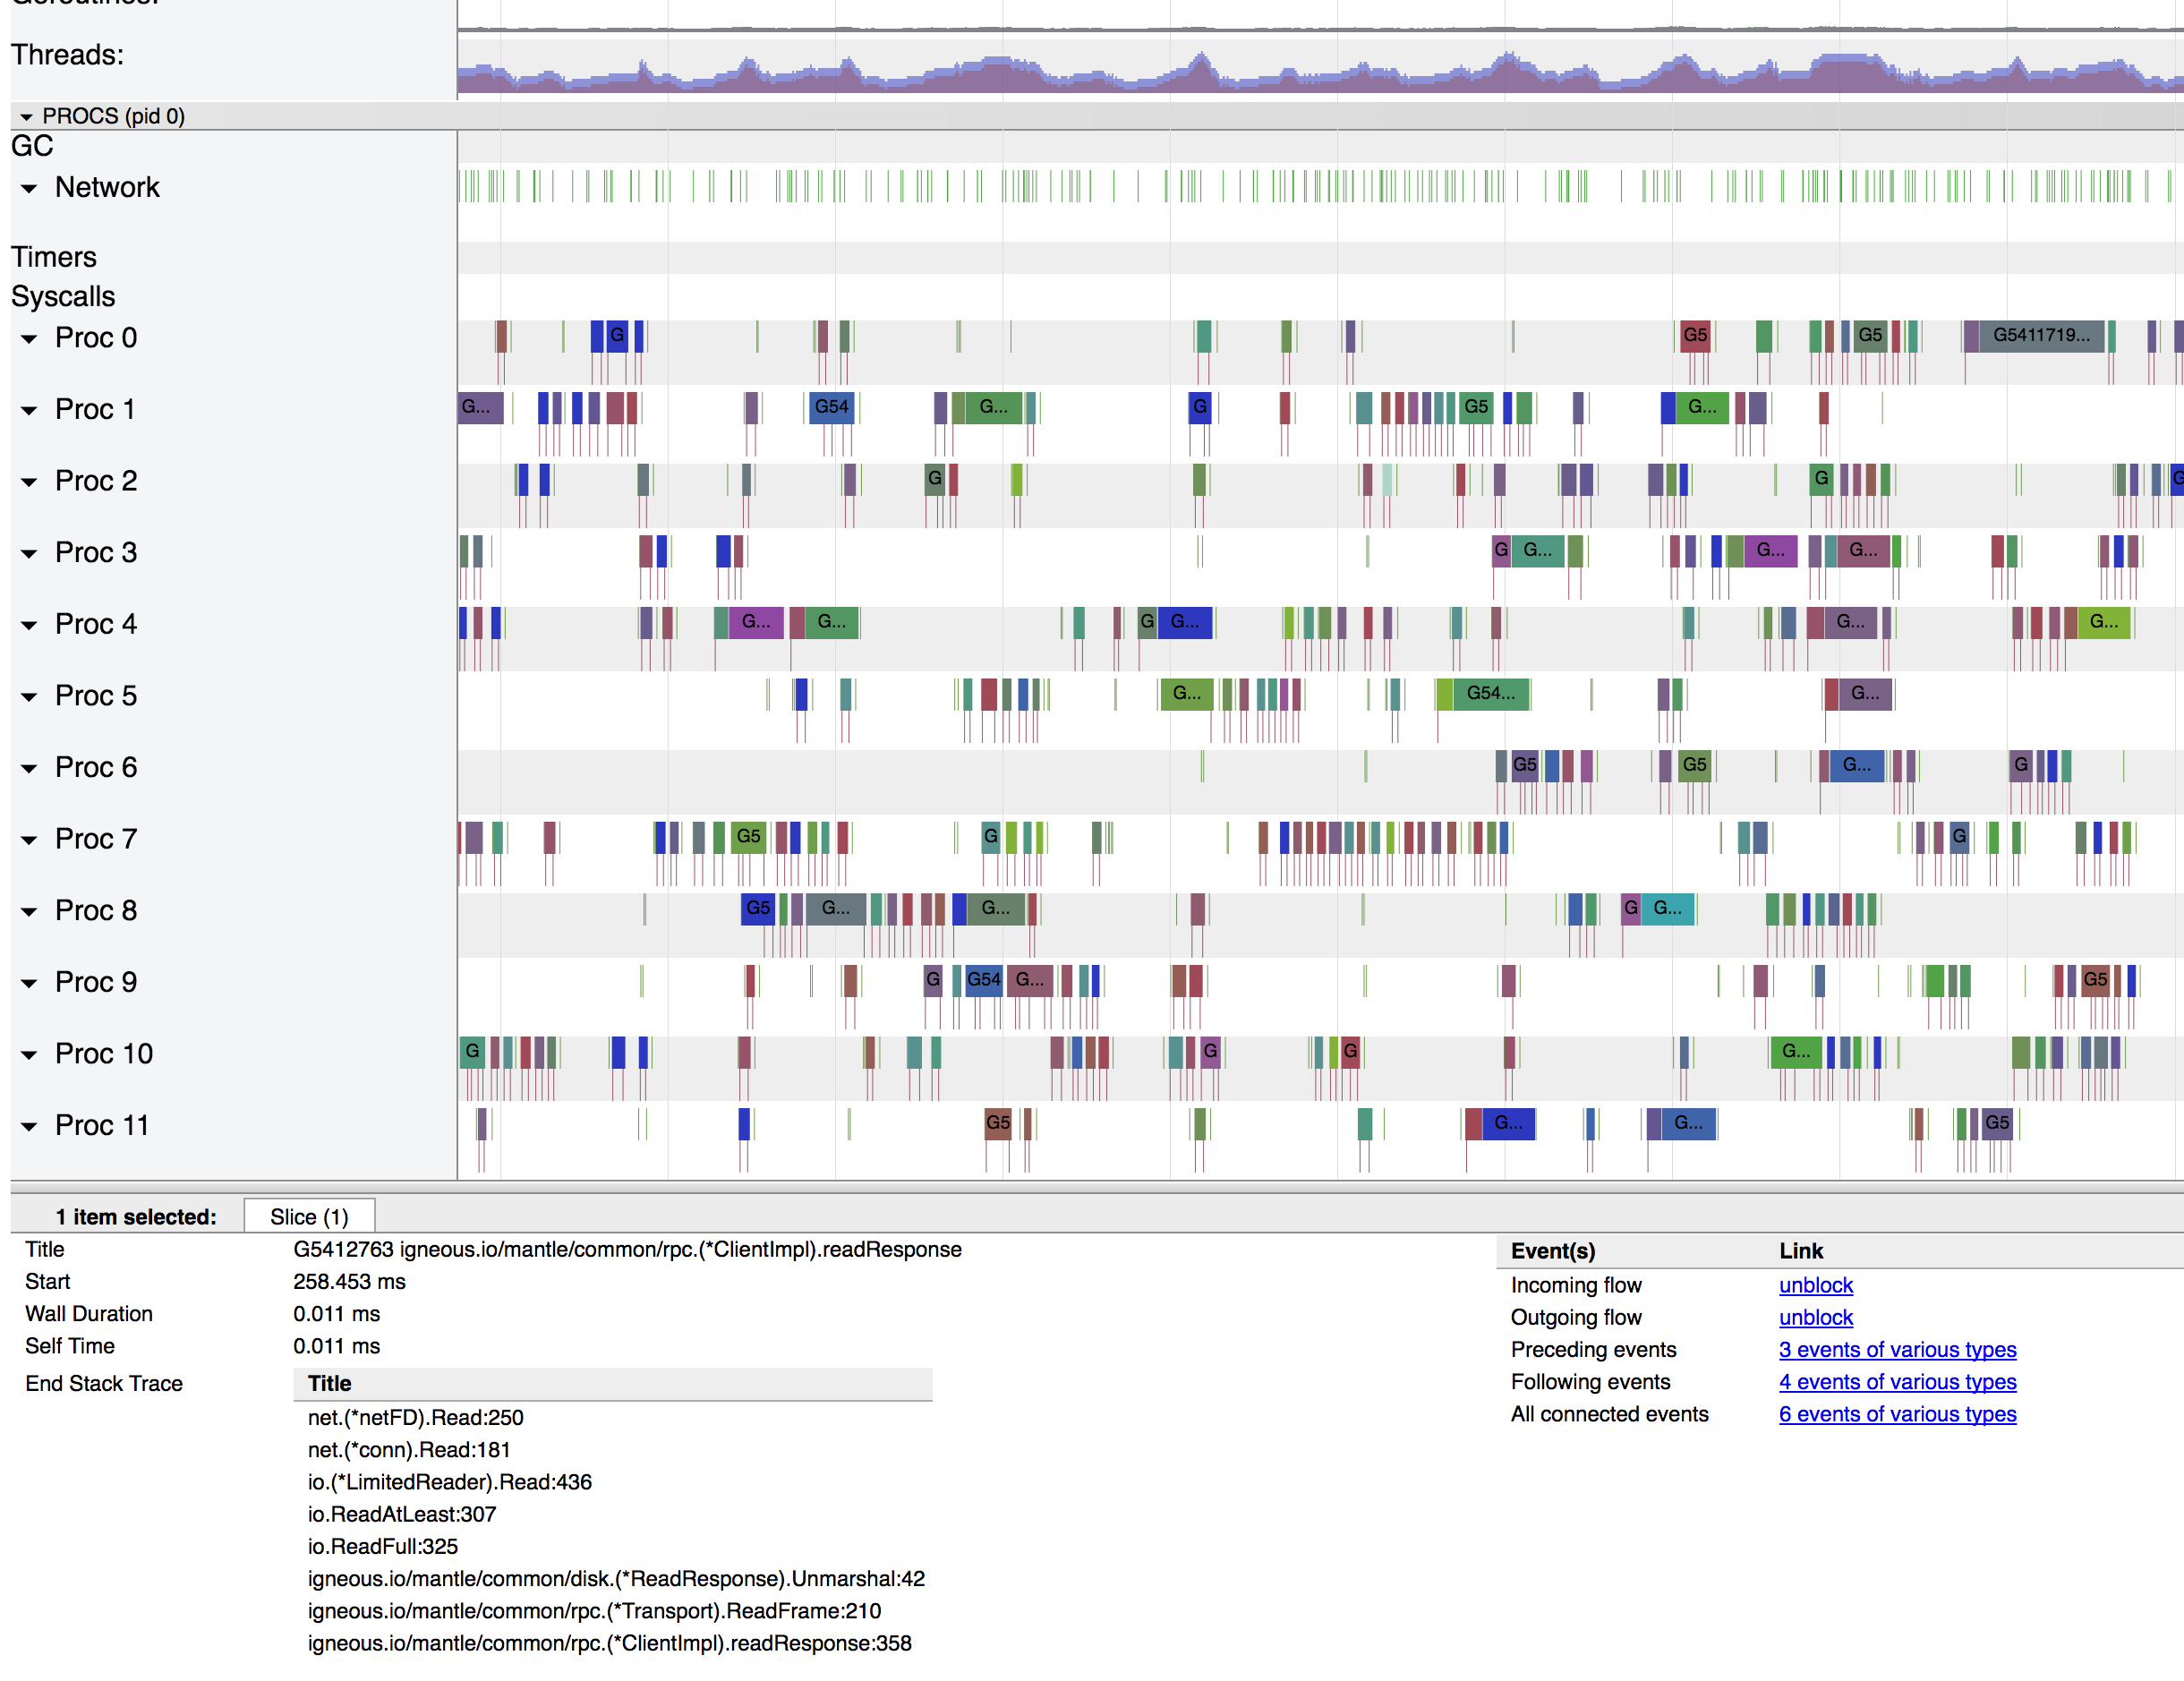
I’ve selected a tiny slice and that’s the identical stack across all the very small routines.
I think this tells the story of the scheduler constantly going idle, then being woken up by the network. Also willing to post some screenshots like this, if there’s more specific questions.