fairlearn: Error Bars/Uncertainty Quantification for MetricFrame
Is your feature request related to a problem? Please describe.
There is currently no built-in way of assessing the volatility or uncertainty associated with metrics generated via MetricFrame. This has important implications for the interpretation of any observed values or differences between groups. For example, if a metric changes significantly under small changes (e.g. through resampling), the difference might be explained fully by something like sampling error.
For example, here is a plot from the FairLearn documentation:
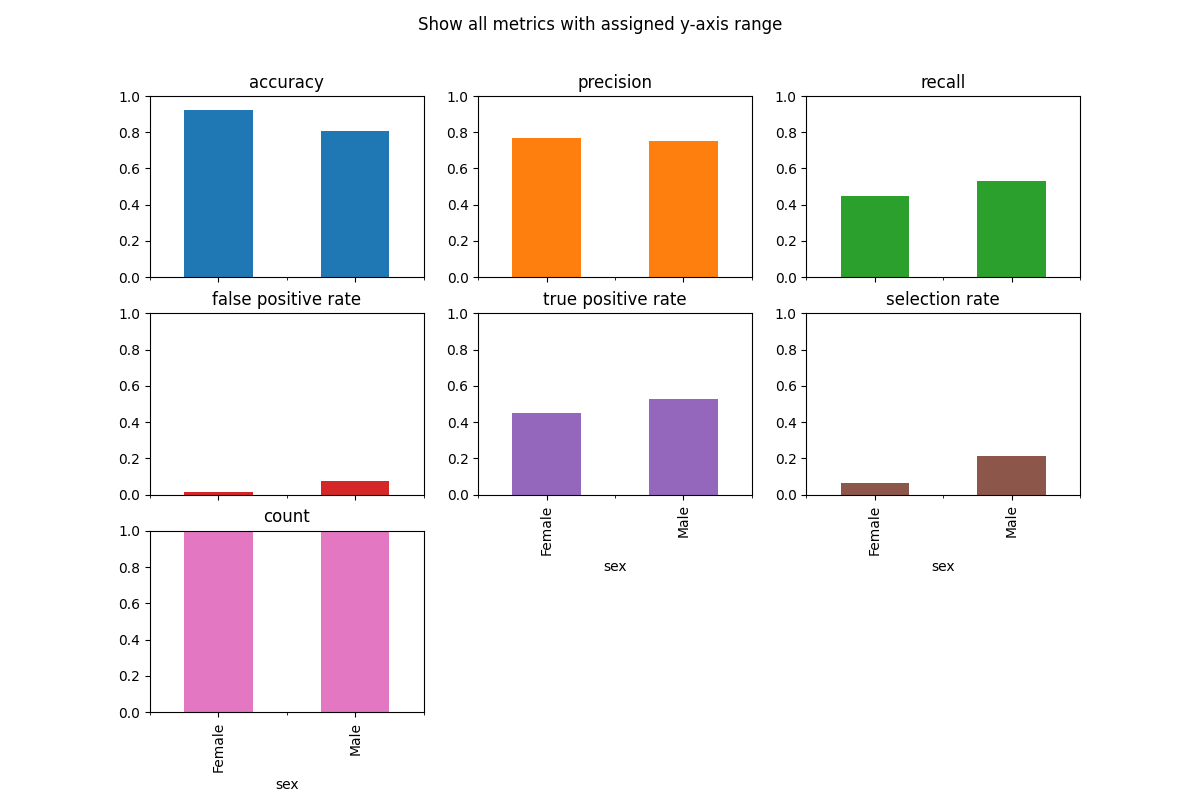
The differences between the two groups in accuracy and selection_rate appear to be larger than the differences in precision and recall. However, it could just be that metrics like selection_rate are inherently higher variance metrics than precision, which might contextualize why the magnitude of the differences is larger.
Describe the solution you’d like
I’d like to propose a bootstrap based solution built directly into MetricFrame. Bootstrap is a conceptually simple procedure that involves building an empirical distribution of a given metric/dataset by repeatedly:
- Sampling up to the full size of the dataset with replacement
- Re-calculating the metric on this new sample
When repeated hundreds or thousands of times, we can study the empirical distribution and produce useful summaries like confidence intervals for the metric.
There are several reasons why bootstrap might be an appropriate solution here:
- It is widely adopted and studied, making it a statistically defensible choice
- Bootstrap is agnostic to characteristics of the dataset and metric, making it largely assumption-free and widely applicable
- It is straightforward to explain and implement as a higher level layer on top of the core MetricFrame subroutines
However, it does come with a few downsides. Primarily, bootstrap is very computationally intensive. By definition, it is 100x - 1000x+ as intensive as running the core MetricFrame routine, which makes performance a key concern. This might be mitigated by:
- Having the bootstrap procedure be opt-in, and defaulted to “off”. This has the added benefit of being completely backwards compatible.
- Improving the performance of the current MetricFrame (which seems to be being addressed by PRs like https://github.com/fairlearn/fairlearn/pull/985).
- Allowing for parallel processing at the bootstrap layer, as bootstrap is an embarassingly parallel operation. This would achieve an approximately linear speedup with the number of available processes on a user machine.
Like most methods, bootstrap also does not work if the user supplied dataset is not representative of the population. In addition, bootstrap will struggle with very low sample size or incredibly homogenous groups (e.g. if every member of group A had an identical label). These should also be addressed with appropriate warnings.
Finally, it’s important to point out that error bars derived from bootstrap cannot directly be used to make claims about statistical significance, especially amongst multiple groups simultaneously. In other words, simply looking at overlaps between error bars does not constitute a formal hypothesis test.
Describe alternatives you’ve considered, if relevant
There are some alternative resampling methods that might provide tighter estimates or be slightly more computationally efficient, like the jackknife, but these are not as well known in the literature.
There is also a complementary line of work possible in structuring formal hypothesis tests, but it would supplement this contribution (and not be in place of it).
Additional context
I’d like to work on adding support for bootstrap and confidence intervals in FairLearn. I’m opening this issue to solicit community and maintainer feedback on the general idea, proposed approach, and finer details around the implementation. In addition to general comments, some thoughts on the following topics would be appreciated.
Performance / Parallel Processing
As mentioned earlier, one way to mitigate performance concerns would be to introduce parallel processing capabilities into FairLearn specifically for the bootstrap layer. Because scikit-learn is already a FairLearn dependency, we could use the joblib library to achieve this with relatively little additional code without taking on any additional dependencies. I’d just like to make sure the concept of multiprocessing and an explicit (rather than implicit) joblib dependency is OK first.
API
There’d be a few proposed changes to the MetricFrame API here, both in the input parameters to the constructor and the output data formats. Here’s an example of what the new constructor may look like (additional parameters annoted with a # NEW comment):
def __init__(self,
             *,
             metrics: Union[Callable, Dict[str, Callable]],
             y_true,
             y_pred,
             sensitive_features,
             control_features: Optional = None,
             sample_params: Optional[Union[Dict[str, Any], Dict[str, Dict[str, Any]]]] = None,
             n_boot: Optional[int] = None,  # NEW
             quantiles: Tuple[float, ...] = (2.5, 97.5), # NEW
             n_jobs: int = -1 # NEW
):
n_boot is the number of bootstrap iterations to run. This can be defaulted to None, which means skipping the bootstrap process altogether and ignoring the following parameters. In practice, it would be recommended to set this to ~1000.
quantiles are the percentiles from the empirical bootstrap distribution to preserve and report back to the user. This is defaulted to (2.5, 97.5) to represent a 95% confidence interval, but can easily be changed to an 80% interval by setting it to (10, 90). With this type of parameter specification, users can also sample more points than just the endpoints of the confidence interval – for example, if you are interested in every quartile, the API would be flexible enough to allow for e.g quantiles = (2.5, 25, 50, 75, 97.5), or to allow for asymmetric confidence intervals. We could easily drop this though and replace it with a single floating point number representing the width of the CI.
n_jobs is the popular joblib/scikit-learn parameter representing how many cores a user is willing to use on their machine for parallelization. n_jobs=1 would use a single processor, n_jobs=-1 uses every available processor, n_jobs=-2 is all but one processor, etc. More information here: https://scikit-learn.org/stable/glossary.html#term-n_jobs
In terms of output structure, there are two choices that come to mind: modifying the internals of each .by_group dataframe to hold something like a tuple instead of a scalar in each cell, or returning a separate frame for each requested quantile. I tend to prefer the latter approach, which may look something like this:
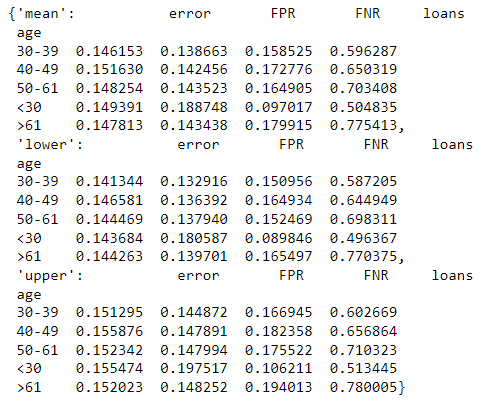
because of its readability and ease of working with – any operation or workflow established on the “main” frame would also work for the quantiles. It would be great to hear thoughts on this, and if it seems like a decent idea, how it might be exposed off the main MetricFrame object (for example, maybe mf.by_group_intervals or mf.by_group_quantiles)?
Finally, in terms of plotting, the Pandas Dataframe plotting API has support for error bars: https://pandas.pydata.org/pandas-docs/stable/user_guide/visualization.html#plotting-with-error-bars , and it might be straightforward to extend the plotting documentation to accommodate this.
Would appreciate any and all thoughts! -Harsha
About this issue
- Original URL
- State: open
- Created 3 years ago
- Comments: 18 (13 by maintainers)
Having had a meeting with @MiroDudik and @Harsha-Nori , my problem was thinking about the issue backwards. I’m more used to the case of seeing people claim that two points with massively overlapping error bars are actually different. However, for fairness (at least as practised by
MetricFrame) the ‘good’ case is where the numbers are the same (because you then have zero disparity), so the incentives for stretching the statistics are reversed.Hence point above that making bootstrapping a builtin of
MetricFrame, we can add errors to thedifference()andratio()methods, which is where the errors are really useful.Some quick thoughts:
I’m in favor of this being part of
MetricFrame. First, because of convenience, but more importantly, because we really need to be able to obtain error bars ondifference(),ratio(),group_max(), andgroup_min(). The error bars on those are particularly important for the ability to quantify fairness.Also, I agree that we should document how we suggest that the data scientist view these error bars. For example, when comparing, say, false positive rate (FPR) on two segments of population, the data scientist shouldn’t be necessarily looking for the overlap, but instead should be looking at what’s the worst case difference between those two groups (i.e., the opposite of the overlap).
Basically, in the context of fairness, we are not worried that the point estimates are too pessimistic, we are actually worried that the point estimates might be too optimistic, and so with error bars on subpopulations, we are looking at their extreme values. If the error bars are too big, this means that we have too little data–and with the data that we have, it might be the case that the two subpopulations have indeed starkly different FPRs even if their error bars overlap (if their error bars are also big).
Another usage of the
MetricFramewith error bars is to examine the error bars ofdifference()(or some of the other aggregates), and again the focus should be on the worst case. This can be even turned into a statistical test. If we get a 95%-confidence interval [a,b] for the value of the difference, we can reject the hypothesis thatdifference()>b at p=0.05 (in fact we might get a better p, because the test is one-sided, whereas the confidence interval is two-sided).Also want to call out that @fredcam has expressed interest in working on this too, so we’ll be handling this together 🙂
Based on the conversation on the call today (12/1/2022), I’m in favor of thinking about the use case where we would like to surface confidence intervals (rather than arbitrary quantiles). With that in mind, I think it might be good to center the API on enabling confidence intervals, supporting both one sided and two-sided versions.
I think that here are some API choices:
Specifying conf. interval quantiles:
a. in constructor: –> two-sided:
MetricFrame(..., ci_quantiles=[0.025,0.975], ...)–> lower only:MetricFrame(..., ci_quantiles=[0.05], ...)–> upper only:MetricFrame(..., ci_quantiles=[0.95], ...)–> multiple conf. levels:MetricFrame(..., ci_quantiles=[0.005,0.025,0.975,0.995], ...)b. in methods/properties:
difference(..., ci_quantiles=[0.025,0.975])by_group) would need to become methods, or separate methods would need to be introduced likeby_group_ci()The invocation format to obtain confidence intervals:
a. new methods/properties via suffix, e.g.,
by_group_ci,difference_ci()b. new arguments to existing methods/properties, e.g.,
difference(..., ci_quantiles=[...], ...)by_group, it would need to change from a property to a methodc. a field that behaves like a MetricFrame, e.g.,
mf.ci.by_group,mf.ci.difference()The return type, e.g., of
by_group_ciordifference_ci()a. list of frames
b. frame of lists
c. frame with a hierarchical column index
I’m tentatively in favor of 1a, 2a, 3a.
Yes! That’s exactly what I had in mind – it should work reasonably well even if we have many groups, because we don’t have to worry about multiple hypothesis testing. However, we’ll need to ensure that we deal correctly (that means conservatively) with some bad cases. The main bad case is when the number of data points in one of the subgroups, say G is too small. This can demonstrate in a variety of ways. Two extreme examples that come to mind:
I am not aware of how to address the latter point in the fully distribution-free manner. The most appealing approach to me would be to allow the user specify the range of values that the metric can take (e.g., [0,1] in case of the binary metrics), which seems like a minimal information that would then allow us to construct conservative confidence intervals. Plus we would issue warnings if we detect sample sizes too small and the metric ranges are not specified. (Another alternative would be to go Bayesian and construct credible intervals, but perhaps we can keep that for future.)
Nice. I wasn’t aware that that’s how these are called!