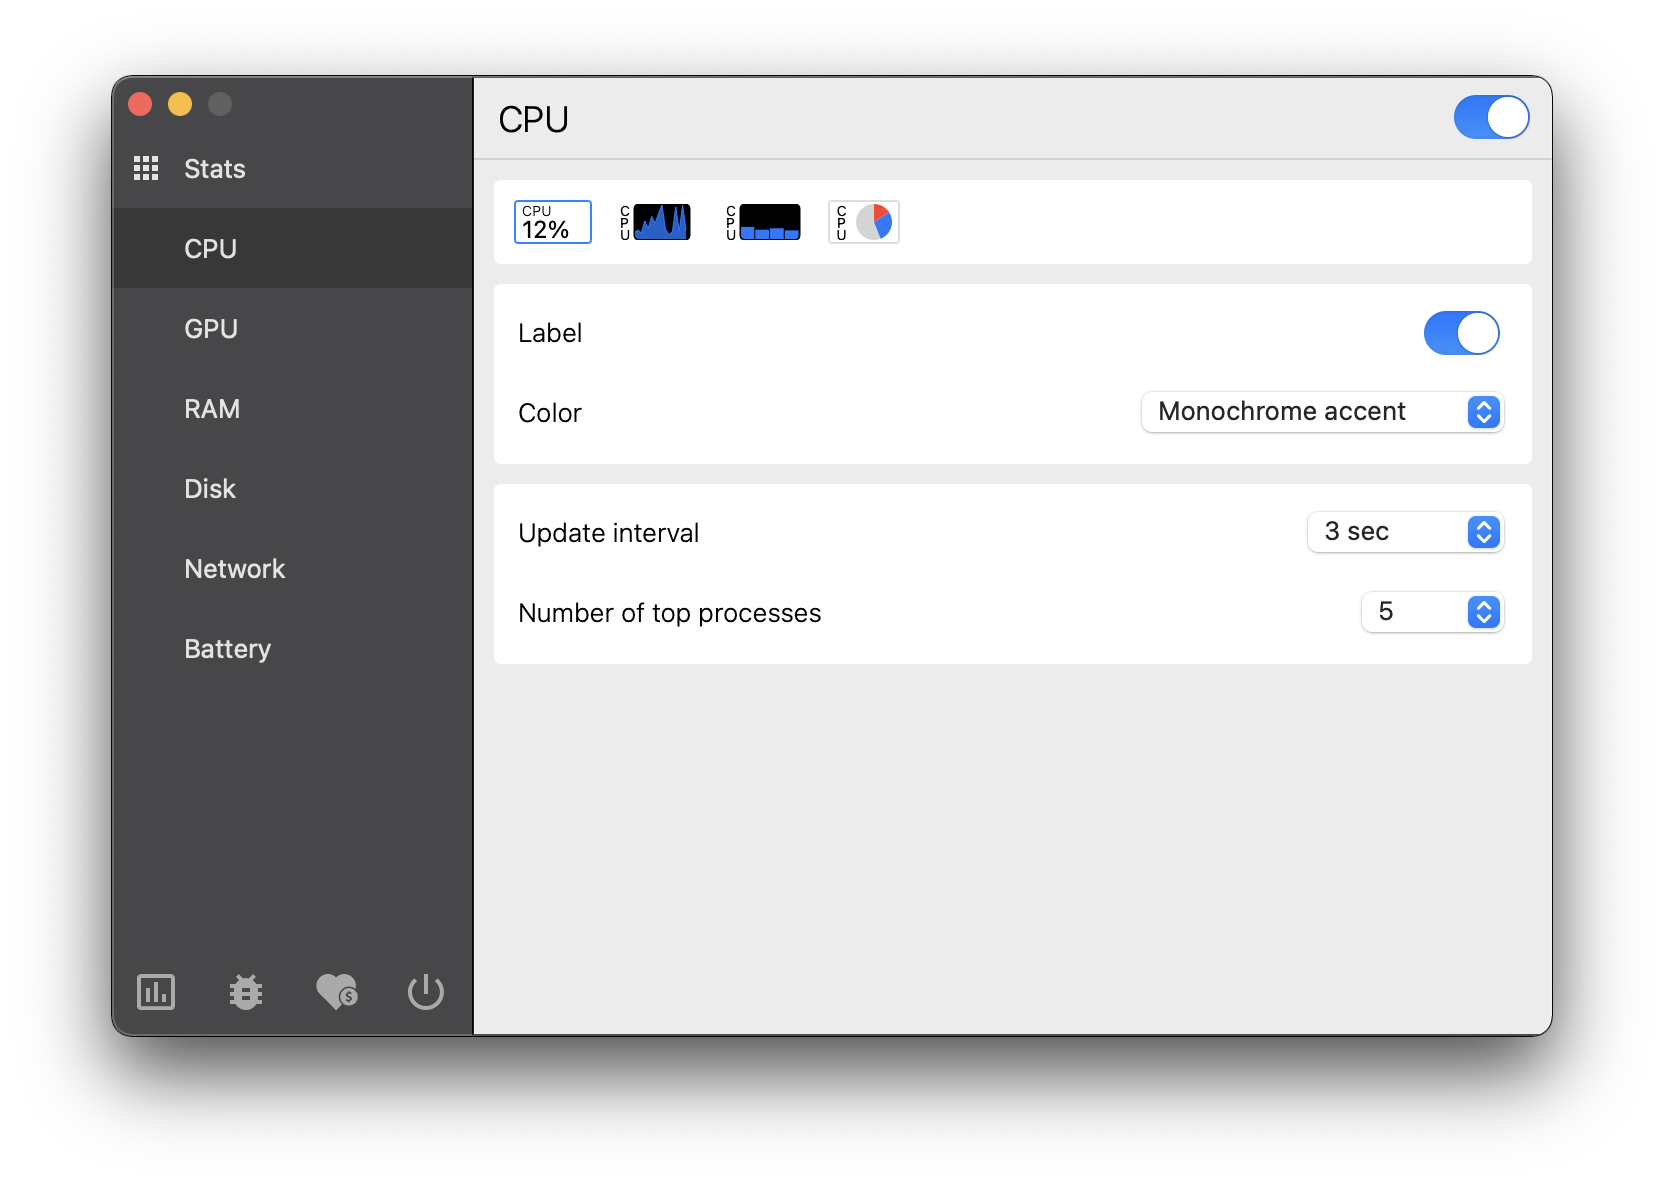
stats: MacBook Air (M1, 2020) visual bugs
Describe the bug There are a few visual bugs I have noticed in the few hours I have been using stats for.
- Battery health says 2% (good), I think this is due to the calculation not subtracting the degradation from 100. (100-2 = 98% health)
- Only one of the CPU dials is filled, not sure what the other one is supposed to display. Also, I think it would be nice if we could display CPU core/thread usage for each core/thread
- I also cannot see any method of checking system temperatures, yet in the battery view it is happy to report 30°c
- On the topic of battery, I think it would be nice if we could see the current discharge in watts.
Details:
- Device:
MacBook Air (M1, 2020) - MacOS:
11.1 B2 - Application version:
2.4.7


About this issue
- Original URL
- State: closed
- Created 4 years ago
- Comments: 29 (18 by maintainers)
Commits related to this issue
- - hide temperature indicator from the CPU popup if not available (#222) — committed to exelban/stats by exelban 4 years ago
- - add battery power (TDP) to the Batter popup view (#222) — committed to exelban/stats by exelban 4 years ago
- fix: fixed battery health for apple silicon (#222) — committed to exelban/stats by exelban 3 years ago
- - hide temperature indicator from the CPU popup if not available (#222) — committed to gmcinalli/stats by exelban 4 years ago
- - add battery power (TDP) to the Batter popup view (#222) — committed to gmcinalli/stats by exelban 4 years ago
- fix: fixed battery health for apple silicon (#222) — committed to gmcinalli/stats by exelban 3 years ago
Hi. Thanks for the feedback.
current capacity/designed capacity. And it looks likeDesignCapacityfield is missing on m1. (need some help to research how it can be fixed).Bar Chartwidget.