envoy: GRPC-Web occasionally not sending responses back to clients
GRPC-Web connections occasionally get in to a broken state
First things first, this environment is running Istio 1.9.6 with Envoy version 172db4cfdf037bc8cf1613969f94c25b6198bc4f/1.17.1/Clean/RELEASE/BoringSSL
Occasionally an Envoy sidecar seems to get in to a state where it will silently (?) drop GRPC-Web responses instead of sending the GRPC -> HTTP/2 responses back to the client/browser. We are still not a 100% sure that this issue sits with Envoy, as it could be an issue with the upstream, but we haven’t been able to narrow it down more than this. Figured it’d be worth filing an issue to see if we can narrow it down further.
The symptoms are that the browser is just continuously trying to send messages every 10 seconds and timing out. On our application side (Go GRPC server) we are getting context cancelled errors when we are trying to send messages on the “broken” GRPC stream AFTER ~10 seconds, when the browser closes the connection. Before this the GRPC Server is happily sending messages on the stream, they’re just not getting to the client/browser.
The high-level architecture is this: Browser -> Istio Ingress (Envoy) -> Sidecar (Envoy) -> Go GRPC server
We only run ONE replica of the Go GRPC server, so all GRPC-Web connections go to this one server.
We have not been able to reliably reproduce this yet. This happens maybe 4-5 times in a week in our fairly low-traffic development environment, but more frequently in the production environment, but we are having issues tracking this issue, so unsure how frequent it is. Our solution to capture information in our development environment has been to turn everything to Debug and analyse everything for a week.
The browser side
We first figured this would be a GRPC-Web browser-side issue, so started capturing information there.
We managed to capture some netlog from a Chrome browser that was in this “broken” state. The “broken” state is on the left and a normal successful connection on the right as comparison:
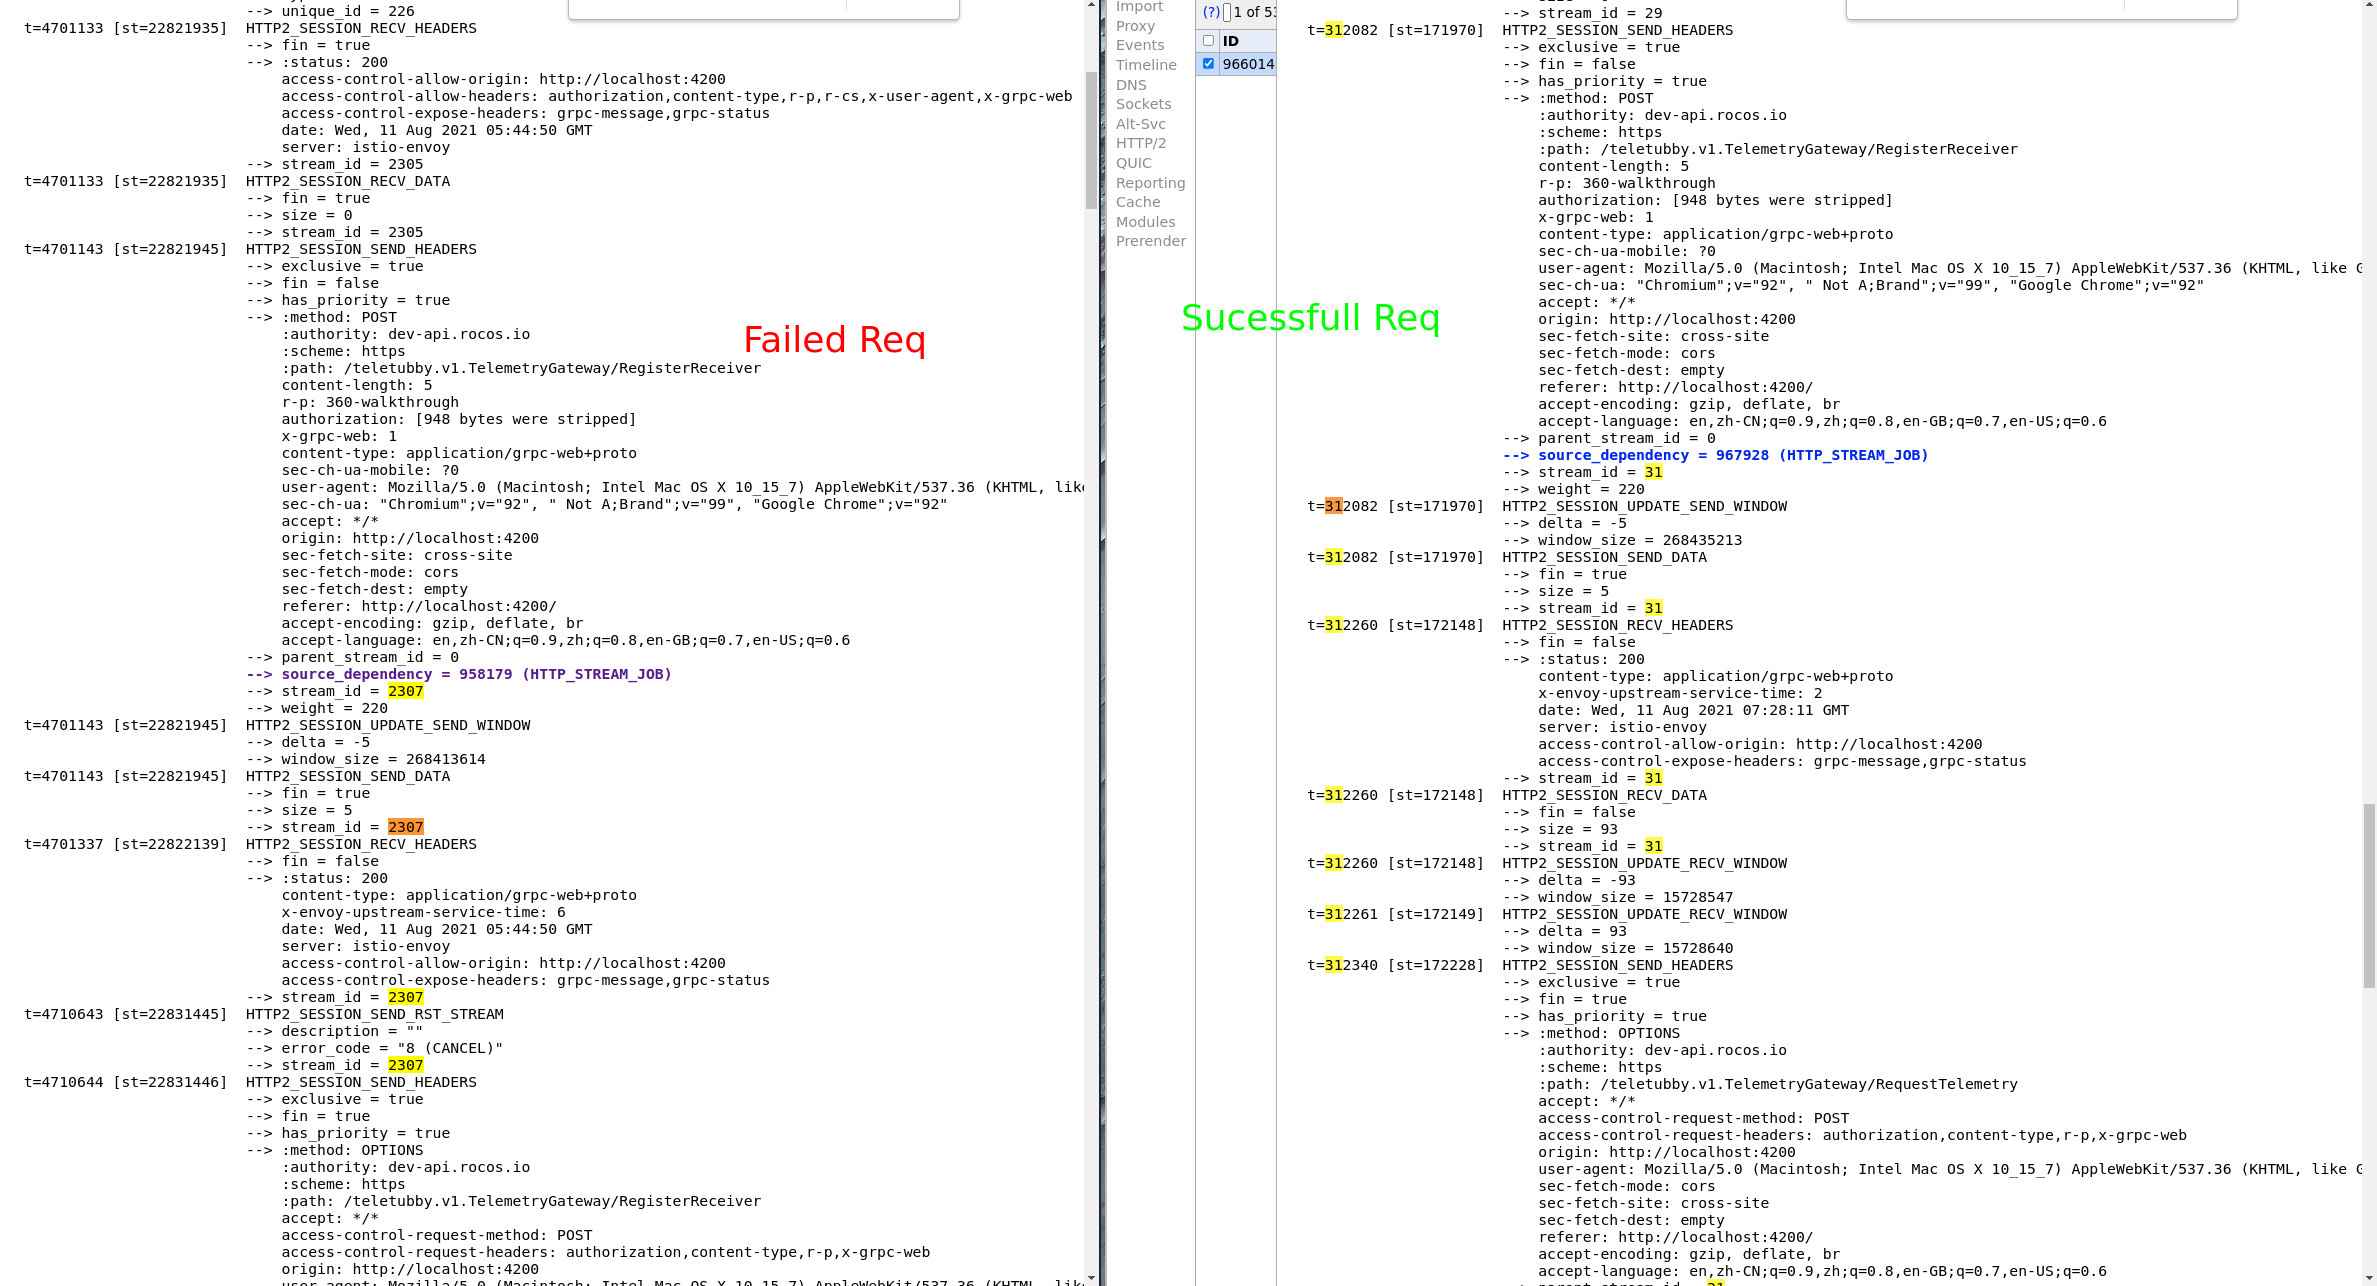
As you can see it never receives any data after it receives the headers from Envoy/server, where as in the successful one it immediately receives data after the headers.
When a browser gets in to this state, you can to completely restart it or do some kind of hard refresh. Just refreshing the page doesn’t seem to help.
The Envoy side
The Envoy Access logs and Debug logs didn’t show anything obvious, as Envoy (correctly) thinks these connections have been gracefully and correctly closed. So everything is 200 / 0 with no error flags.
However, if we filter on any connection that lives for about 10 seconds, we can see a pattern. This also revealed that specific Connection IDs seem to have the issue.
For example if connection ID C150 has the issue and 2 different clients/browsers are connection through this connection ID, they will both have their responses from the Go GRPC server dropped.
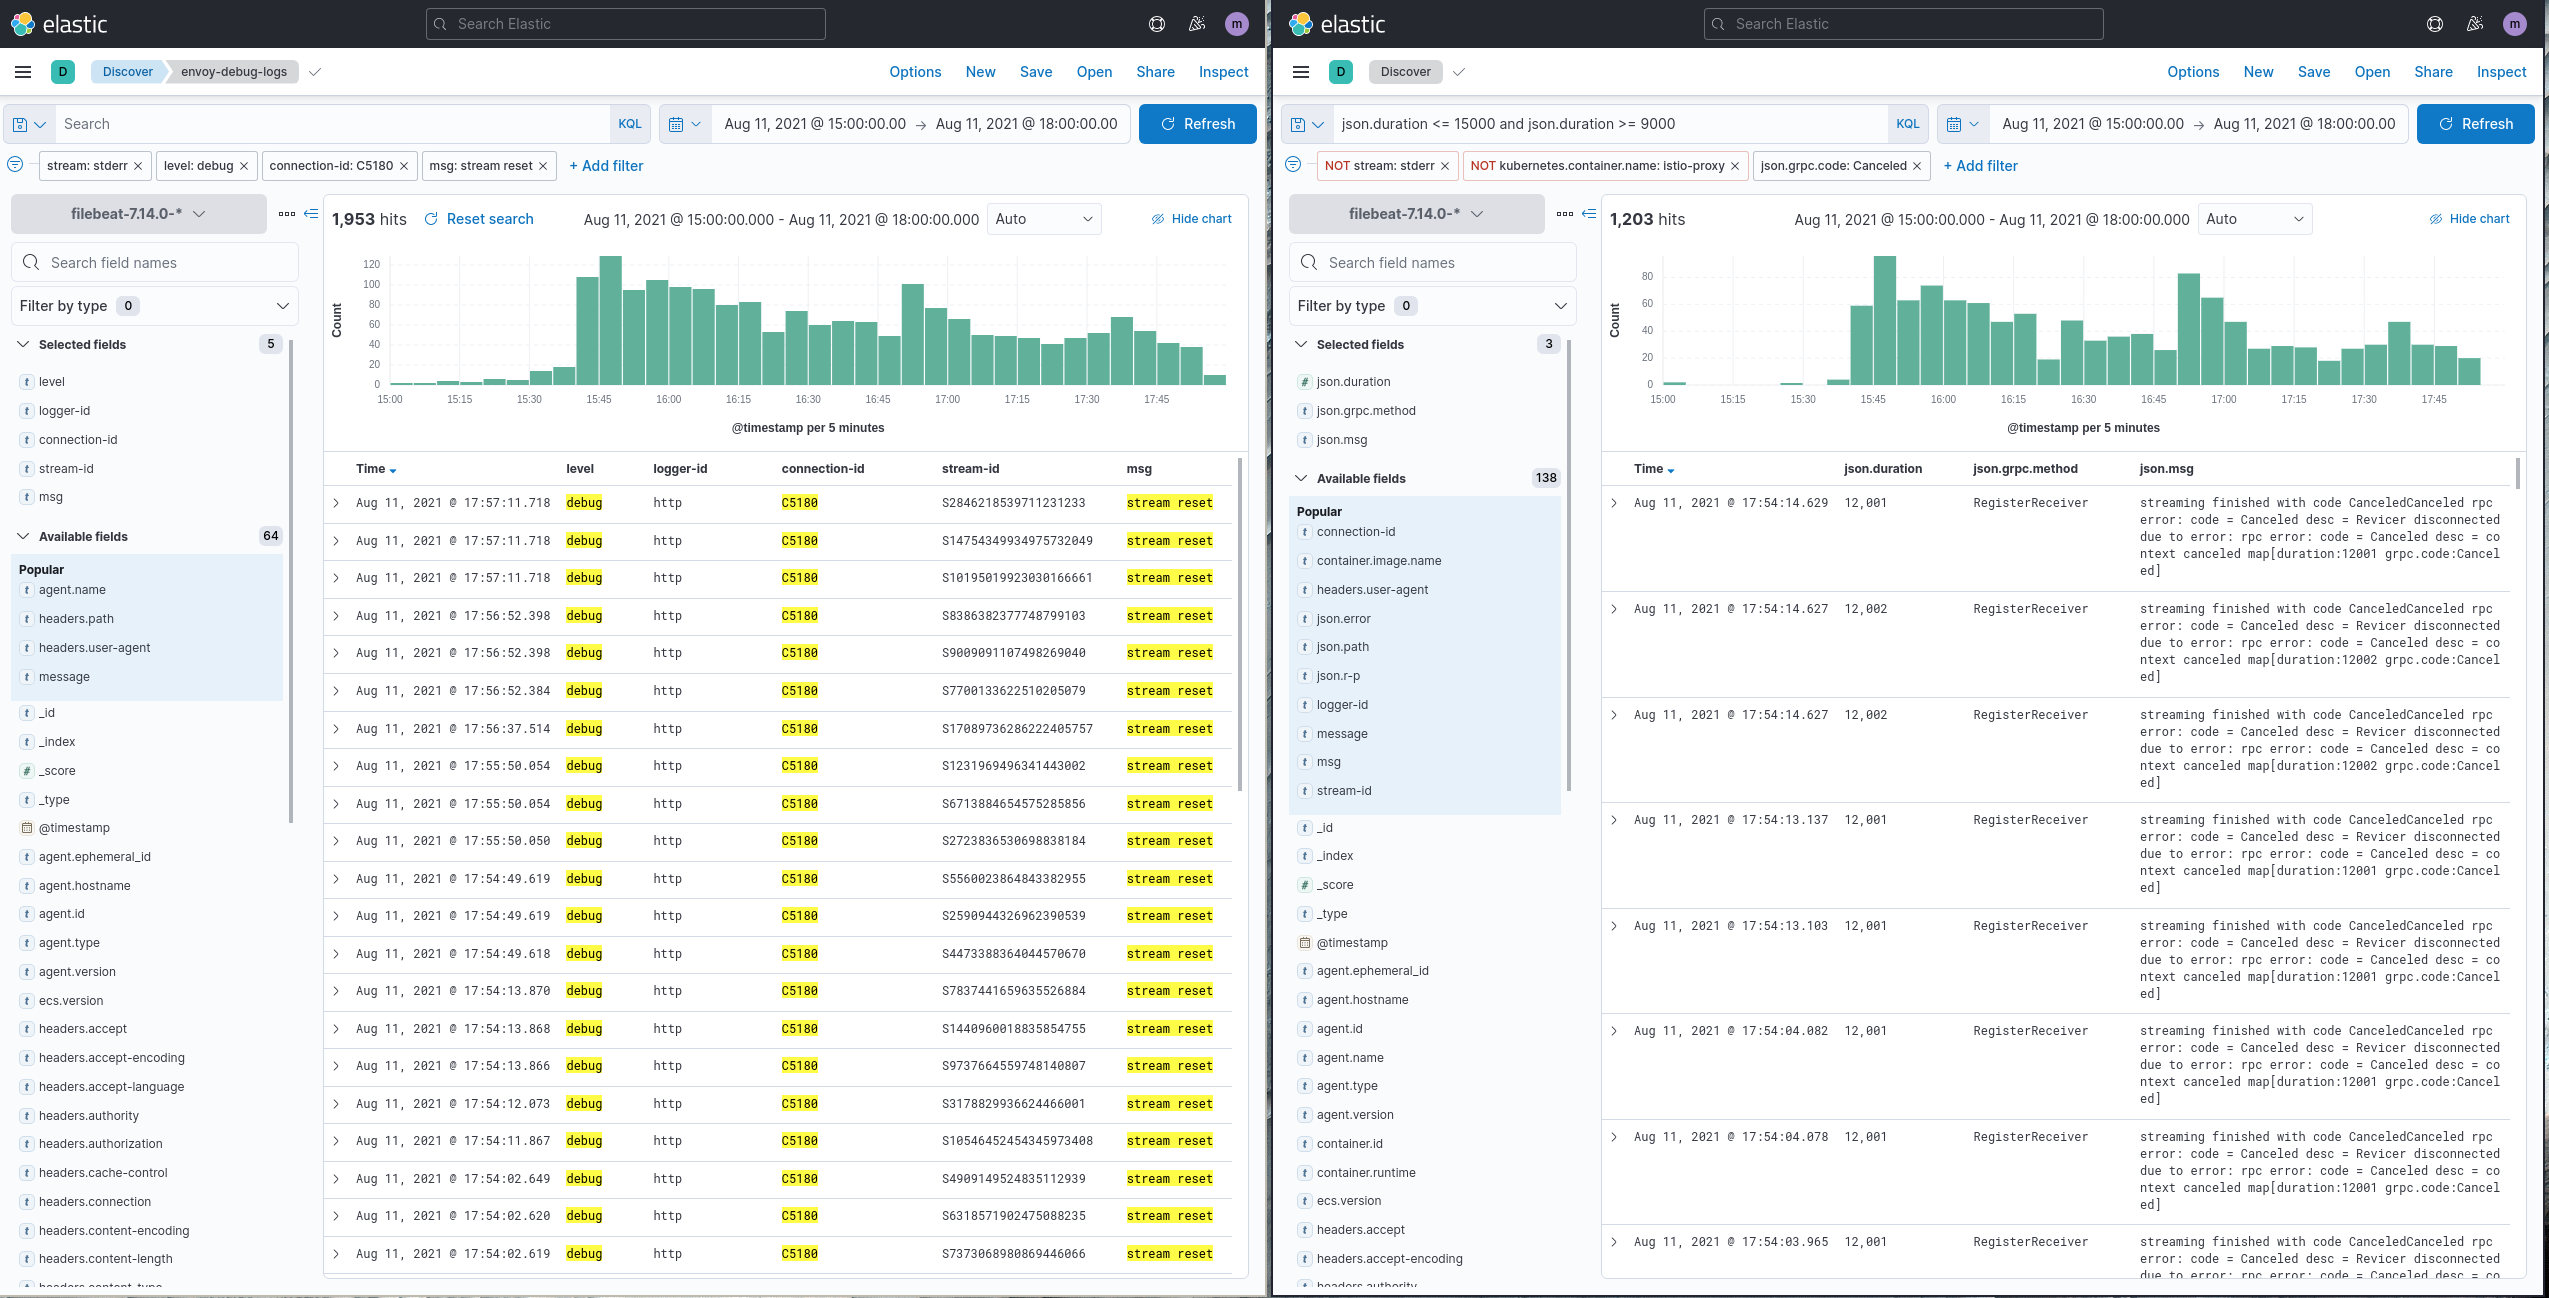 This is not the best evidence, but on the left is the Envoy Stream Reset messages from the “broken” connection ID in one of the timespans that had the issue, and on the right is the Go GRPC server context cancelled messages, all with a duration of ~
12,000 milliseconds. The extra 2 seconds is because of the healthcheck message being sent every 4 seconds, so doesn’t catch the stream closing at 10 seconds, but instead notices at 12 seconds when it tries to send on the stream.
Since we can’t easily reproduce this I haven’t been able to run this with Envoy at a trace level yet, but I will try to set it to trace as soon as we identify the issue happening again.
Let me know what else I can provide here, or any potential workarounds as this is affecting us in production right now.
About this issue
- Original URL
- State: open
- Created 3 years ago
- Comments: 18 (7 by maintainers)
I hear you - intermittent issues are the worst to debug. I guess if I were trying to track this down I’d try a couple of things. I’d try to come up with a repro case, with an Envoy set up in my custom configuration and varied payloads. If I were sure the connection was around and the data was not processed I’d focus on proxying different size payloads and maybe even tweaking network or kernel buffer conditions to try to force it to wedge and capture Envoy logs and tcpdump for debug. If it could be a connection close issue I’d be more focused on response code details, seeing if there was a spike in an unusual error response cause when I saw the issues.
Please test with a more recent version of Envoy. 1.17.1 is quite old and it’s possible whatever issue this is has been fixed.