electron: Electron 6 BrowserWindow Debugger freezes indefinitely, without apparent pattern
Preflight Checklist
- I have read the Contributing Guidelines for this project.
- I agree to follow the Code of Conduct that this project adheres to.
- I have searched the issue tracker for an issue that matches the one I want to file, without success.
Issue Details
- Electron Version:
6.0.10 - Operating System:
Windows 7 - Last Known Working Electron version:
4.1.5
Expected Behavior
Debugger does not bug out and freeze/eat CPU indefinitely
Actual Behavior
Debugging innocuous and functional code that was debuggable in Electron 4 can lead to freezes that require destroying the BrowserWindow or restarting Electron entirely.
To Reproduce
No idea 😦
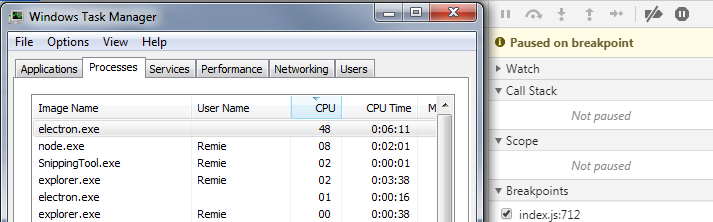
Screenshots
Additional Information
I upgraded and setting breakpoints in working code that was previously debuggable in Electron 4 there are issues. There’s been no changes to that code and the debugger worked fine in Electron 4. I’ve been working on new code and figured that the issue was caused by a bug in my newly written code until just now.
It will stop properly at the breakpoints (in a number of places in my code), and then CPU usage spikes and stays high, taking up 40-45% CPU on my dual core machine. It appears to respond, but if you resume or step ahead nothing happens. If you press Pause script execution, similarly nothing seems to happen except the UI updates. CPU usage remains the same throughout. This code also runs properly when not debugging and last time I ran it in React Native and debugged with React Native Debugger (based on Electron 1.8 I think?)
Hitting Ctrl+P, the quick nav feature comes up as expected, but there’s no files there except the HTML file loaded. Any additional files no longer appear.
Electron 6 is based on Chromium 76, and on some machines Chrome 76 (and 77) shoots to using a full CPU core and doesn’t stop until the process is ended. I wonder if perhaps I’m seeing the same thing here.
About this issue
- Original URL
- State: closed
- Created 5 years ago
- Comments: 17 (11 by maintainers)
I tried to remove the use of the preload script but I still get the same problem.
Yes I have a preload script that is requiring a native node module and adding a variable to the window object to allow calls to me made into native code.
I have found a way to reproduce this error 100% of the time is this:
import { useDrop } from "react-dnd"…
const [{ canDrop, isOver }, drop] = useDrop({ accept: [NativeTypes.FILE], drop(item) { folderBrowserStore.onIngestAsset(currentId, item.files) }, collect: monitor => ({ isOver: monitor.isOver(), canDrop: monitor.canDrop() }) })If you set a breakpoint inside of the drop function and you drag and drop a file from the OS file system then it will always freeze.
This is using Electron version 8.1.1 this time, I tried changing versions but still get the same problem.
I am also facing similar issue after upgrading from 3.x to 6.x At certain part of the code(haven’t figure out a pattern yet), at seemingly random times, when the execution hits a breakpoint, the execution will not resume when you hit the “resume” button. Also, while the execution is halted, any of the “debugging feature”, like inspecting scope variables will not work. I think the two screen shot best summarize the issue at hand.
Issue reproducible on: Node: 12.4.0 Electron : 6.1.1 and 6.1.4 OS: Mac 10.15.1