electron: [Bug]: One webview paused by debugger prevents all webviews from receiving click events
Preflight Checklist
- I have read the Contributing Guidelines for this project.
- I agree to follow the Code of Conduct that this project adheres to.
- I have searched the issue tracker for an issue that matches the one I want to file, without success.
Issue Details
- Electron Version: 11.0.1
- Operating System: macOS 10.14.6
Expected Behavior
Devtools should be interactive and the user can control debugging process
Actual Behavior
Devtools not interactive and the user unable to click on any tabs or buttons. Only scroll works.
To Reproduce
I created a repo to reproduce this behavior - https://github.com/Karine91/devtools-webview To install:
$ git clone https://github.com/Karine91/devtools-webview.git
$ yarn
$ yarn start
After running the project go to the source of preload.js file
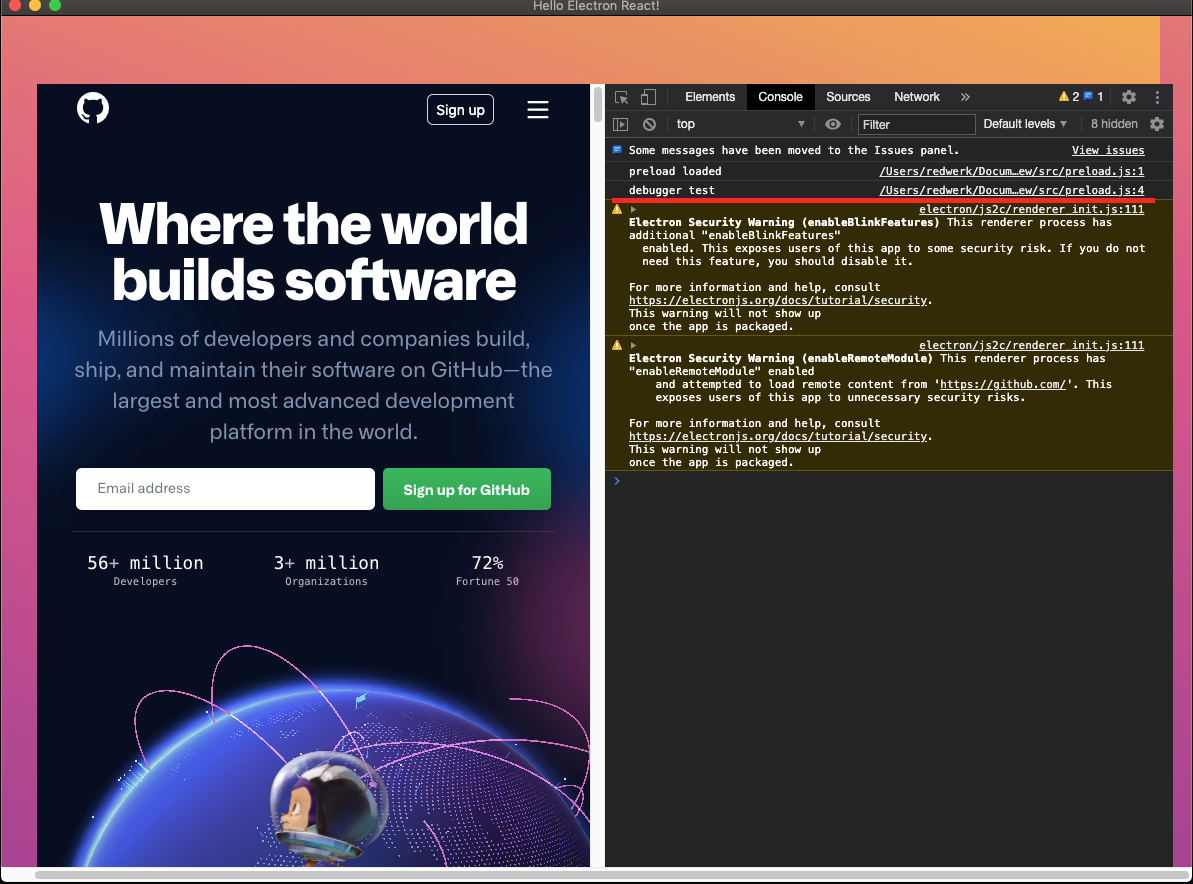 Add debugger breakpoint
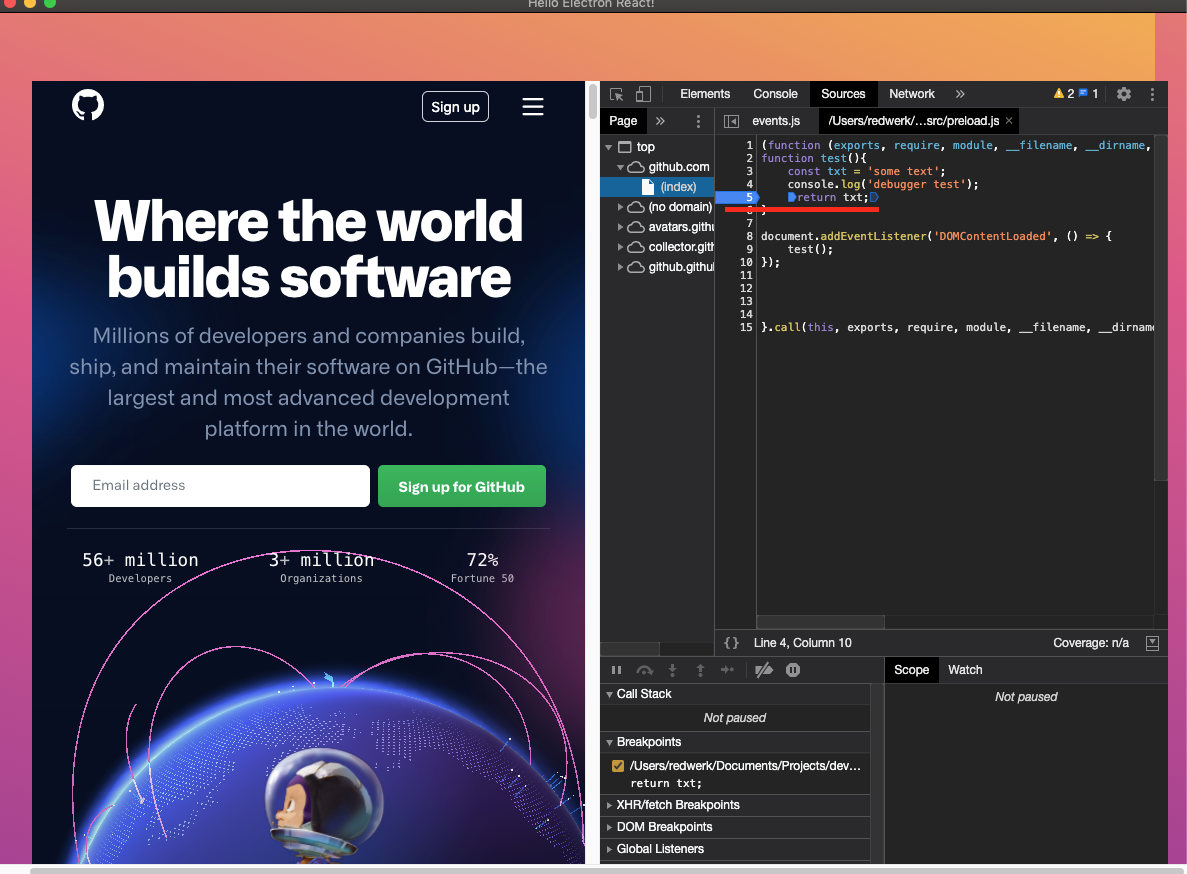
Reload the page by clicking on github logo
 After that debugger paused but you not able to click on any buttons in webview, but scroll works
About this issue
- Original URL
- State: closed
- Created 3 years ago
- Comments: 18 (7 by maintainers)
one workaround I found - it’s set checkbox in devtools settings for ‘Disable paused state overlay’
I’ve generalized this problem into a smaller repro: https://gist.github.com/clavin/236e0943ef72525a573bfb81d1739647
That gist shows two webviews, one on top of the other. The top one has its dev tools open automatically. When the
debuggerbutton is pressed in the top webview it should pause. From there, neither the top nor bottom webviews can be clicked on–even though the bottom one is still running and updating.Further, other interactions like selecting text and keyboard events still make their way into the second webview, just not clicks. This means that the paused top webview cannot be resumed from the debug “paused” overlay on the webview, only from the devtools window.
I found :