ginga: Possible memory leak
Ref: this issue
Summary: Ginga reference viewer may have a memory leak. The basic widget does not exhibit the leak.
- The Ginga reference viewer’s memory limiting option, the
numImageschannel setting, does not seem to be limiting memory use as it used to. When opening multiple files with one channel open and thenumImagesset to a small fixed number, the memory use seems to be rising proportionally to the image array sizes. Instead, the memory size should plateau some short period after the limit has been reached and then only gradually increase by the size of a thumbnail image and a few bits of accounting data. - The problem seems to happen regardless of whether the Qt or Gtk toolkit has been used
- The problem is not exhibited with the basic ginga viewer widget. You can start the
example2_qt.pyand load image after image, the size plateaus after a bit and then just rises and falls within the plateau range.
About this issue
- Original URL
- State: closed
- Created 3 years ago
- Reactions: 1
- Comments: 39 (27 by maintainers)
I have often thought that
numImagesis a bit of a rough tuning parameter. It would make more sense to have the parameter be based on how much memory is being taken by the channel. It seems like with some of the memory packages that are available we might be able to do that. Or bypassing that, just keep a running total per-channel of the bytecount of the data/header areas loaded. Something to think about for a future release, perhaps.Well, it is a “feature” and not a “bug” that Ginga keeps track of every image that you load into it and don’t remove. I think it would qualify as a leak if Ginga does not recover memory for images that you remove. It does remove the pixel and header data for “loaded” images from memory in a user configurable fashion (i.e.
numImages), but keeps enough information to reload the image if possible and to show what is still “remembered” by the viewer. It’s hardly surprising that this bookkeeping for each image does take some space.Now for something completely surprising. Here is loading the same 144 files using the Ginga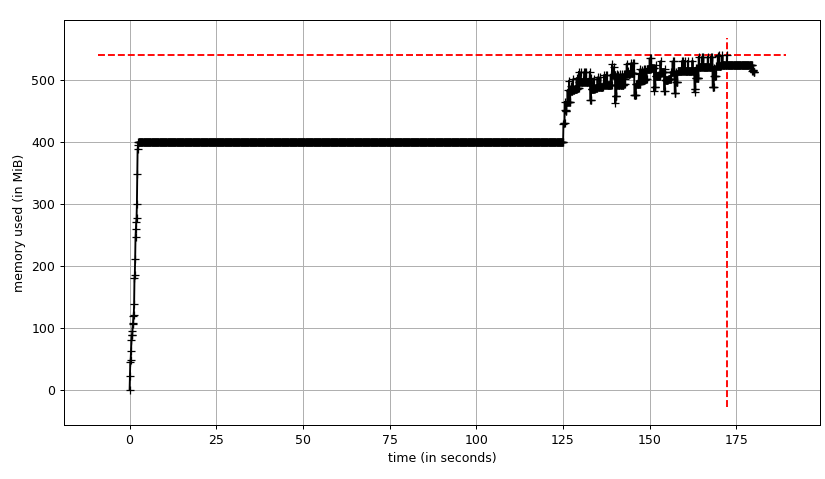
RCplugin (command was “ggrc ginga load_file /path/to/file.fits” successively for 144 files):The big long flat part is just the viewer being idle while I fiddled with an ipython session getting ready to send the commands. All the loads happen in the end. But look at the memory use–it’s only 130-140 MB above an idle, empty Ginga session! This is with the
numImagesset at 2.I just compared two profiles, one with
memmap=Noneand one withmemmap=False. In the case of the latter, there is a significant increased memory usage compared to the default. So we will leave it as is.It’s a good plan. I suspect either a plugin or some change in the renderer, so am starting by disabling most plugins and then slowly adding them back.