eclipse-plugins: Setting breakpoint at Reset_Handler stalls in fpu init
Description
Setting a break point on Reset_Handler seems to stall at fpu init and not going to main using Jlink with cortex m7, however if I specify the program counter at the right address of the main , then I see the starting up going through. To illustrate this, I am setting a break point in my reset handler, as shown in below picture

The reset handler is defined as per
void Reset_Handler( void )
{

    rfeMPU_init();

    rfeSwStartup_enableFPU();

    main( 0, 0 );
}
What I observe is that the debugger seems to stall in the fpu init, hitting the resume button doesn’t help and same debug message is printed in the Console ( beneath correspond to two clicks on resume button)
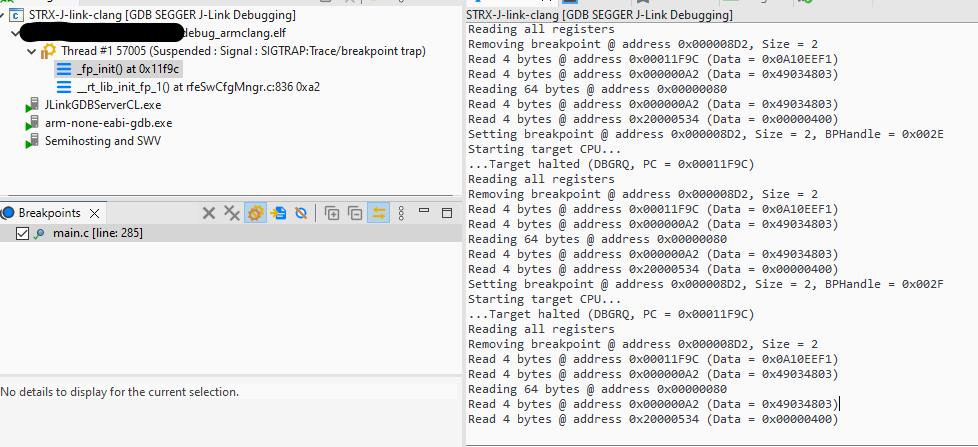
Setting breakpoint @ address 0x000008D2, Size = 2, BPHandle = 0x002D
Starting target CPU...
...Target halted (DBGRQ, PC = 0x00011F9C)
Reading all registers
Removing breakpoint @ address 0x000008D2, Size = 2
Read 4 bytes @ address 0x00011F9C (Data = 0x0A10EEF1)
Read 4 bytes @ address 0x000000A2 (Data = 0x49034803)
Reading 64 bytes @ address 0x00000080
Read 4 bytes @ address 0x000000A2 (Data = 0x49034803)
Read 4 bytes @ address 0x20000534 (Data = 0x00000400)
Setting breakpoint @ address 0x000008D2, Size = 2, BPHandle = 0x002E
Starting target CPU...
...Target halted (DBGRQ, PC = 0x00011F9C)
Reading all registers
Removing breakpoint @ address 0x000008D2, Size = 2
Read 4 bytes @ address 0x00011F9C (Data = 0x0A10EEF1)
Read 4 bytes @ address 0x000000A2 (Data = 0x49034803)
Reading 64 bytes @ address 0x00000080
Read 4 bytes @ address 0x000000A2 (Data = 0x49034803)
Read 4 bytes @ address 0x20000534 (Data = 0x00000400)
Am I configuring something wrongly?
Versions
- [plug-in version]
- [Eclipse version]
Eclipse IDE for C/C++ Developers (includes Incubating components) Version: 2022-06 (4.24.0) Build id: 20220609-1112 - [Java version] ```java version “1.8.0_201” Java™ SE Runtime Environment (build 1.8.0_201-b09) Java HotSpot™ 64-Bit Server VM (build 25.201-b09, mixed mode)
* [operating system] Windows 10

Please understand that without being able to reproduce the bug we cannot identify your problem.

---
About this issue
- Original URL
- State: closed
- Created 2 years ago
- Comments: 55 (17 by maintainers)
I did not try clang for embedded projects yet, so I don’t know how well it is supported by GDB.
If you discover how to make it work, please share your findings.
No. That allows the debugger to access memory regions that are not defined in the linker script. If you set that
onthen you’d have to describe the full memory map, including memory mapped peripherals etc., in the linker script.It’s very common for this to be set to
offfor embedded targets. Having itonprobably makes sense for native development on Linux, Windows, Mac etc. which is probably why the default isongiven that native debugging is the most common case?In any case, this has nothing to do with your program malfunctioning.
The debugger starts from the entry point, usually defined in the linker script.
Thanks @ilg-ul - couldn’t remember offhand. 🙂
It doesn’t. Cortex-M CPUs do this automatically. At startup/post reset they load
$spwith$VTOR[0]and$pcwith$VTOR[4]. Some (early?) cores don’t have a$VTORin which case it’s effectively0x00000000.VTOR = Vector Table Offset Register.
Just to recap, things that I would look at:
p/x mainandp/x Reset_Handler.BKPTinstruction - something that will generally not work directly with flash) but is using hardware breakpoints.