che: Che Theia with low CPU limit doesn't work properly
Describe the bug
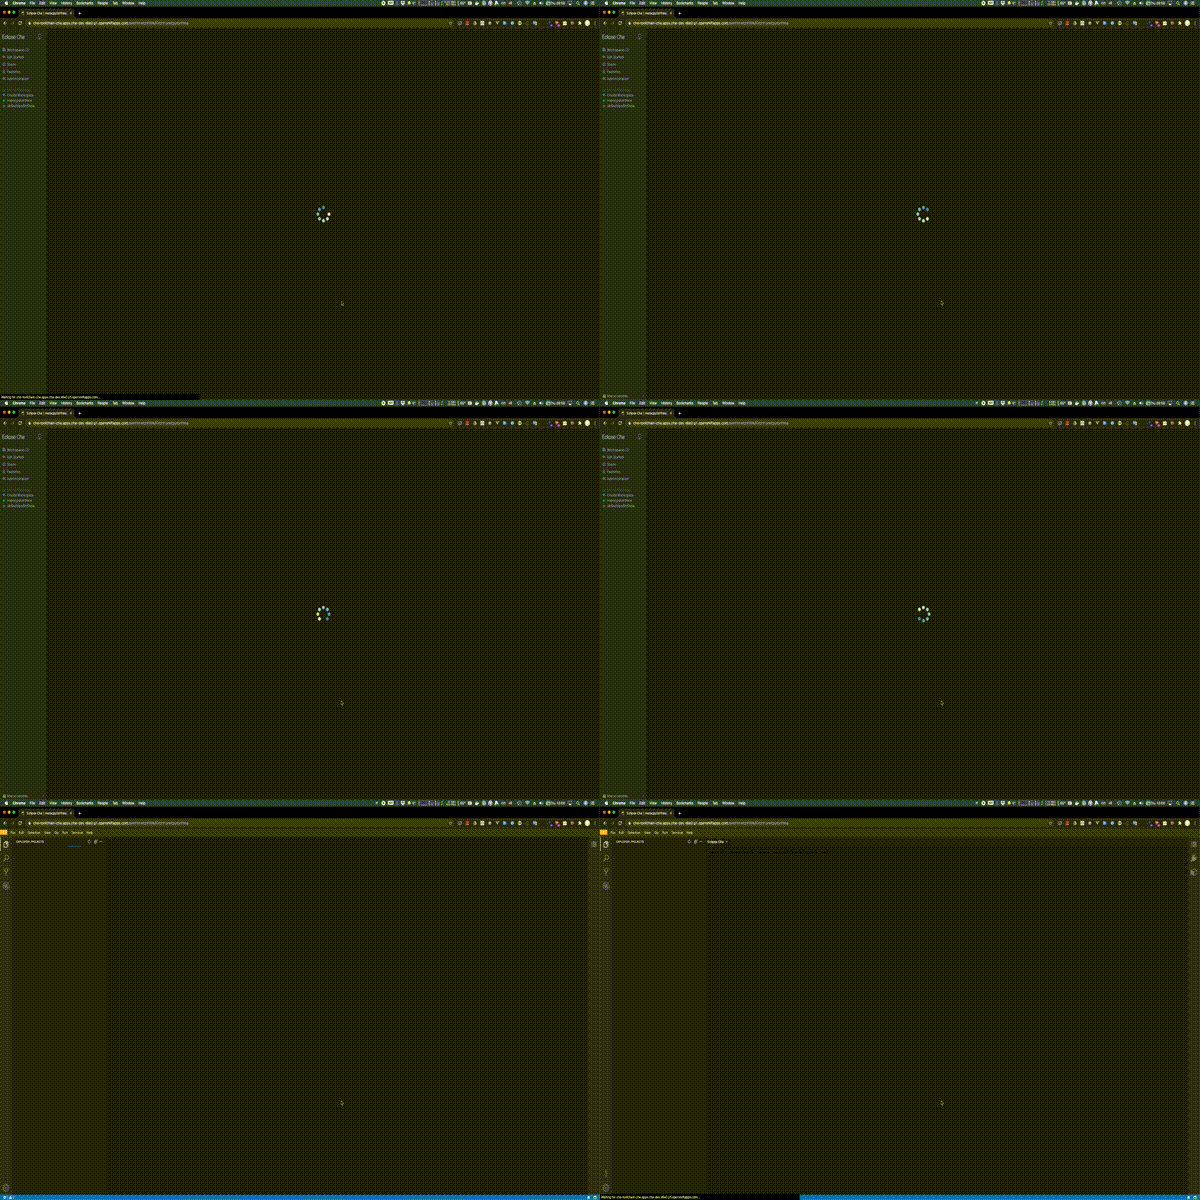
This is an example setting 0.4 cores as Theia CPU limit (63 seconds to load Theia, and ports plugin is not even there):

And another example setting 1.5 cores as Theia CPU limit (18 seconds to load Theia, port plugins included):

So 0.4 core is not enough and 1.5 core are fine but probably even with a lower value the bootstrap would be fast.
In the short term we should:
- Have a rough idea of the minimum value of CPU limit that makes Theia start fast enough
- Specify Theia CPU limit in meta.yaml
In the long term we should (not this issue):
- Benchmark Theia requirements in terms of CPU and memory and have some automated test to verify that
- Have a mechanism to dynamically adapt sidecars CPU limits to the namespace quota: if the cpu limit quota is 10 cores we should make sure that a workspace will use those resources if it needs too.
Che version
7.2.1
Steps to reproduce
In this devfile Theia is set with 400m:
apiVersion: 1.0.0
metadata:
  name: notenoughcpu
components:
  - cpuLimit: 400m
    id: eclipse/che-theia/next
    type: cheEditor
and it can be compared with Theia that has a fair amount of CPU:
apiVersion: 1.0.0
metadata:
  name: alotofcpu
components:
  - cpuLimit: 1500m
    id: eclipse/che-theia/next
    type: cheEditor
Runtime
Additional context
Even if we currently do not explicitly specify Che Theia CPU limit in its meta.yaml we can set sidecars (including Theia) CPU limits if through:
- Che property
CHE_WORKSPACE_DEFAULT__CPU__LIMIT__CORESis set - The namespace LimitRange
spec.limits[.type == "Container"].default.cpu
But those values are usually low (0.4 core on devsandbox for example). That’s because the sum of sidecars limits has to be lower than the namespace quotas spec.quota.hard.limit.cpu (4 cores on devsandbox for example).
Theia bootstrap can be significantly slower and unstable if the CPU is too limited.
About this issue
- Original URL
- State: closed
- Created 4 years ago
- Reactions: 1
- Comments: 21 (17 by maintainers)
To verify the assumptions, it would be interesting to graph and compare the following queries in the Metrics UI over a 15 minutes interval (replacing
<che-pod>and<che-namespace>by the actual values):sum by(pod, namespace) (rate(container_cpu_usage_seconds_total{container="",pod="<che-pod>",namespace="<che-namespace>"}[5m]))(equivalent to pod:container_cpu_usage:sum)sum by(pod, namespace) (irate(container_cpu_usage_seconds_total{container="",pod="<che-pod>",namespace="<che-namespace>"}[5m]))(the irate variant)sum by(container, pod, namespace) (irate(container_cpu_usage_seconds_total{container!="",pod="<che-pod>",namespace="<che-namespace>"}[5m]))(the irate variant per container)Here is an example for the prometheus pod on a random cluster, the dark blue line is the rate() query, the green line is the irate() query for the pod and the light blue is the irate() for the prometheus container (the other containers consume almost 0 CPU).
@l0rd it calls Metrics API, like
kubectl get --raw /apis/metrics.k8s.io/v1beta1/namespaces/{che-namespace}/pods/{workspace_pod}@ibuziuk I guess that the other containers are not using CPU during the bootstrap. I had not seen
kubectl top --containers=trueoption but indeed that would be useful.I have done some investigation as well 😄
First, on “what a core is?” this comment helps.
Second I have looked at the metrics returned by
kubectl topand from there we can see that the pod reaches 390m cores:And if instead I specify 1500m cores: