runtime: Native memory leak with ETW EventSource
Reported originally at https://github.com/Microsoft/ApplicationInsights-dotnet/issues/1102
Repros on .NET Core 2.2, x86 and x64 on Windows.
Build the following application:
using System.Diagnostics.Tracing;

namespace RPESLeak
{
    class MyEventSource : EventSource
    {
        private const EventKeywords Operations = (EventKeywords)0x1;

        private const string EventProviderName = "PSH-LeakTest";

        public MyEventSource() : base(
               EventProviderName,
               EventSourceSettings.EtwSelfDescribingEventFormat)
        {
        }

        public void ProcessOperationStart(long operation)
        {
            if (IsEnabled(EventLevel.Informational, Operations))
            {
                var payload = new { Leak = "leaky", Id = operation };
                Write(
                    "Request",
                    new EventSourceOptions { Keywords = Operations, Opcode = EventOpcode.Start, Level = EventLevel.Informational },
                    payload);
            }
        }
    }

    class Program
    {
        static void Main(string[] args)
        {
            var eventSource = new MyEventSource();
            for (long i = 0; ; i++)
            {
                eventSource.ProcessOperationStart(i);
            }
        }
    }
}
Run it on Windows and watch the memory usage of dotnet.exe in Task Manager. It settles down on my machine around 10 MB.
Now enable the ETW event listener for the event source. The easiest way to do that is to run PerfView. Press Alt+C to start a collection and make it look like this:
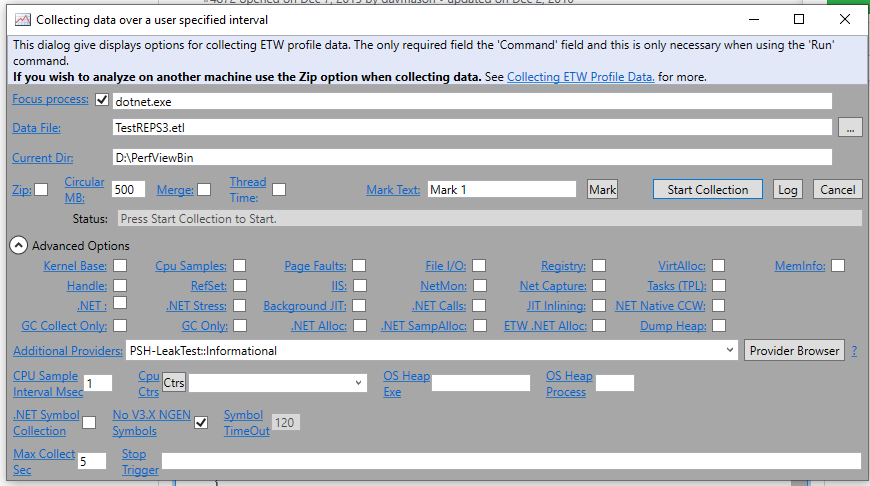
The important thing is to add this in Additional Providers:
PSH-LeakTest::Informational
You can turn off all the other options.
Now, when you start logging, watch the memory usage in dotnet.exe climb like crazy (over 200 MB in 5 seconds).
When you stop logging, the memory isn’t freed. If you create a dump of the dotnet.exe process, the GC heap is fine. Most of the additional memory is in native heap and it seems to consist of the event manifests repeated over and over again.
This does not reproduce on .NET 4.7.2 I don’t know about earlier .NET Core runtimes.
Please let me know if you need any more information, but I think this is a pretty minimal repro with clear instructions. One thing I could do is eliminate PerfView by writing a custom app based around TraceEvent or even a WPR profile.
To be clear how this affects Application Insights customers: The Application Insights Profiler runs in Azure App Services. It captures ETW sessions for 2 minutes at a time about once an hour. One of the providers it enables (listens to), is the Application Insights “Rich Payload Event Source” (see the original bug in the Application Insights repo). Customers are now encountering these memory leaks under load when profiling is running leading to application restarts.
About this issue
- Original URL
- State: closed
- Created 5 years ago
- Reactions: 3
- Comments: 37 (25 by maintainers)
I’m preparing port to 2.2 right now.
@jorive - it sounds like this bug is rather severe. I think we have a strong case to back-port it to V2.2. We should pursue that.
cc @josalem
That definitely doesn’t sound normal to me either.
This makes me less nervous. That being said, AFAIK @jorive already ported his fix (https://github.com/dotnet/coreclr/pull/23661) to 2.2 and if it’s not addressing the issue, we might be looking at a different issue from one that was already ported.
Do you happen to have a memory dump and/or a small repro that I can use to repro the behavior?
@mjsabby memory isn’t used when pipe is disabled, when enabled memory usage climbs like crazy under traffic, while heap usage remains at same level @jorive is buffer size configurable? It looks like it’s little bit to much, use 1 gb of memory if you want to gather some basic metrics for dashboard and monitoring
Including @brianrob who wrote this.
I took a quick look and the key place is the stack
Which says that starting with an event write, we try to create a handle for it (for EventPipe), and this seems to allocate ALL THE TIME. However a handle to an event is about its Meta-Data, and thus there should be a lookup and MOST of the time we should NOT be creating new event meta-data.
Thus the basic issue is that we are missing our ‘lookup’ that would find that we already have meta-data for this event.
@brianrob - Can you quickly tell us where it SHOULD be happening?
There is a secondary issue that we should not need this meta-data at all unless EventPipe is turned on (which it is not), so it would be nice if we avoided even generating the handle if EventPipe is off.
@jorive - We should also check the scenario where we are collecting with EventPIpe instead of ETW before we call this bug fixed.
Thanks @pharring, I am able to repro it locally with the code above.
@pharring I’m taking a look.
The thought occurred to me that PerfView is just the tool for tracking down the heap allocations. Indeed, here are the relevant allocating stacks: