aspnetcore: AspNet Core 2.2.7 memory leak on alpine 3.9 docker image
Describe the bug
We recently updated our aspnet core application to use the mcr.microsoft.com/dotnet/core/aspnet:2.2.7-alpine3.9 docker image. We let it soak on 2 separate staging & test environments and noted that both steadily consumed more and more memory.
We continued to monitor for several days expecting the memory usage to flatten out at some point, but it just kept growing.
I updated the docker image to use mcr.microsoft.com/dotnet/core/aspnet:2.2.7-alpine and the memory usage growth disappeared entirely.
The growing memory usage was observed regardless of traffic or load of the container, even an idle container has exhibited the pattern.
The growing memory usage was observed on both container metrics as well as the reported WorkingSetSize from the application itself. GC Memory remained stable, so the growth does not stem from managed objects.
To Reproduce
Steps to reproduce the behavior: ( I have not yet been able to test if any aspnet core project will exhibit this behavior or if it has to do with any of the code in our application )
- Using this docker image
mcr.microsoft.com/dotnet/core/aspnet:2.2.7-alpine3.9 - Wait roughly ~10 hours+
- Observe memory usage of the container instance over time.
Expected behavior
Memory usage should stabilize at a reasonable value and not continue to grow.
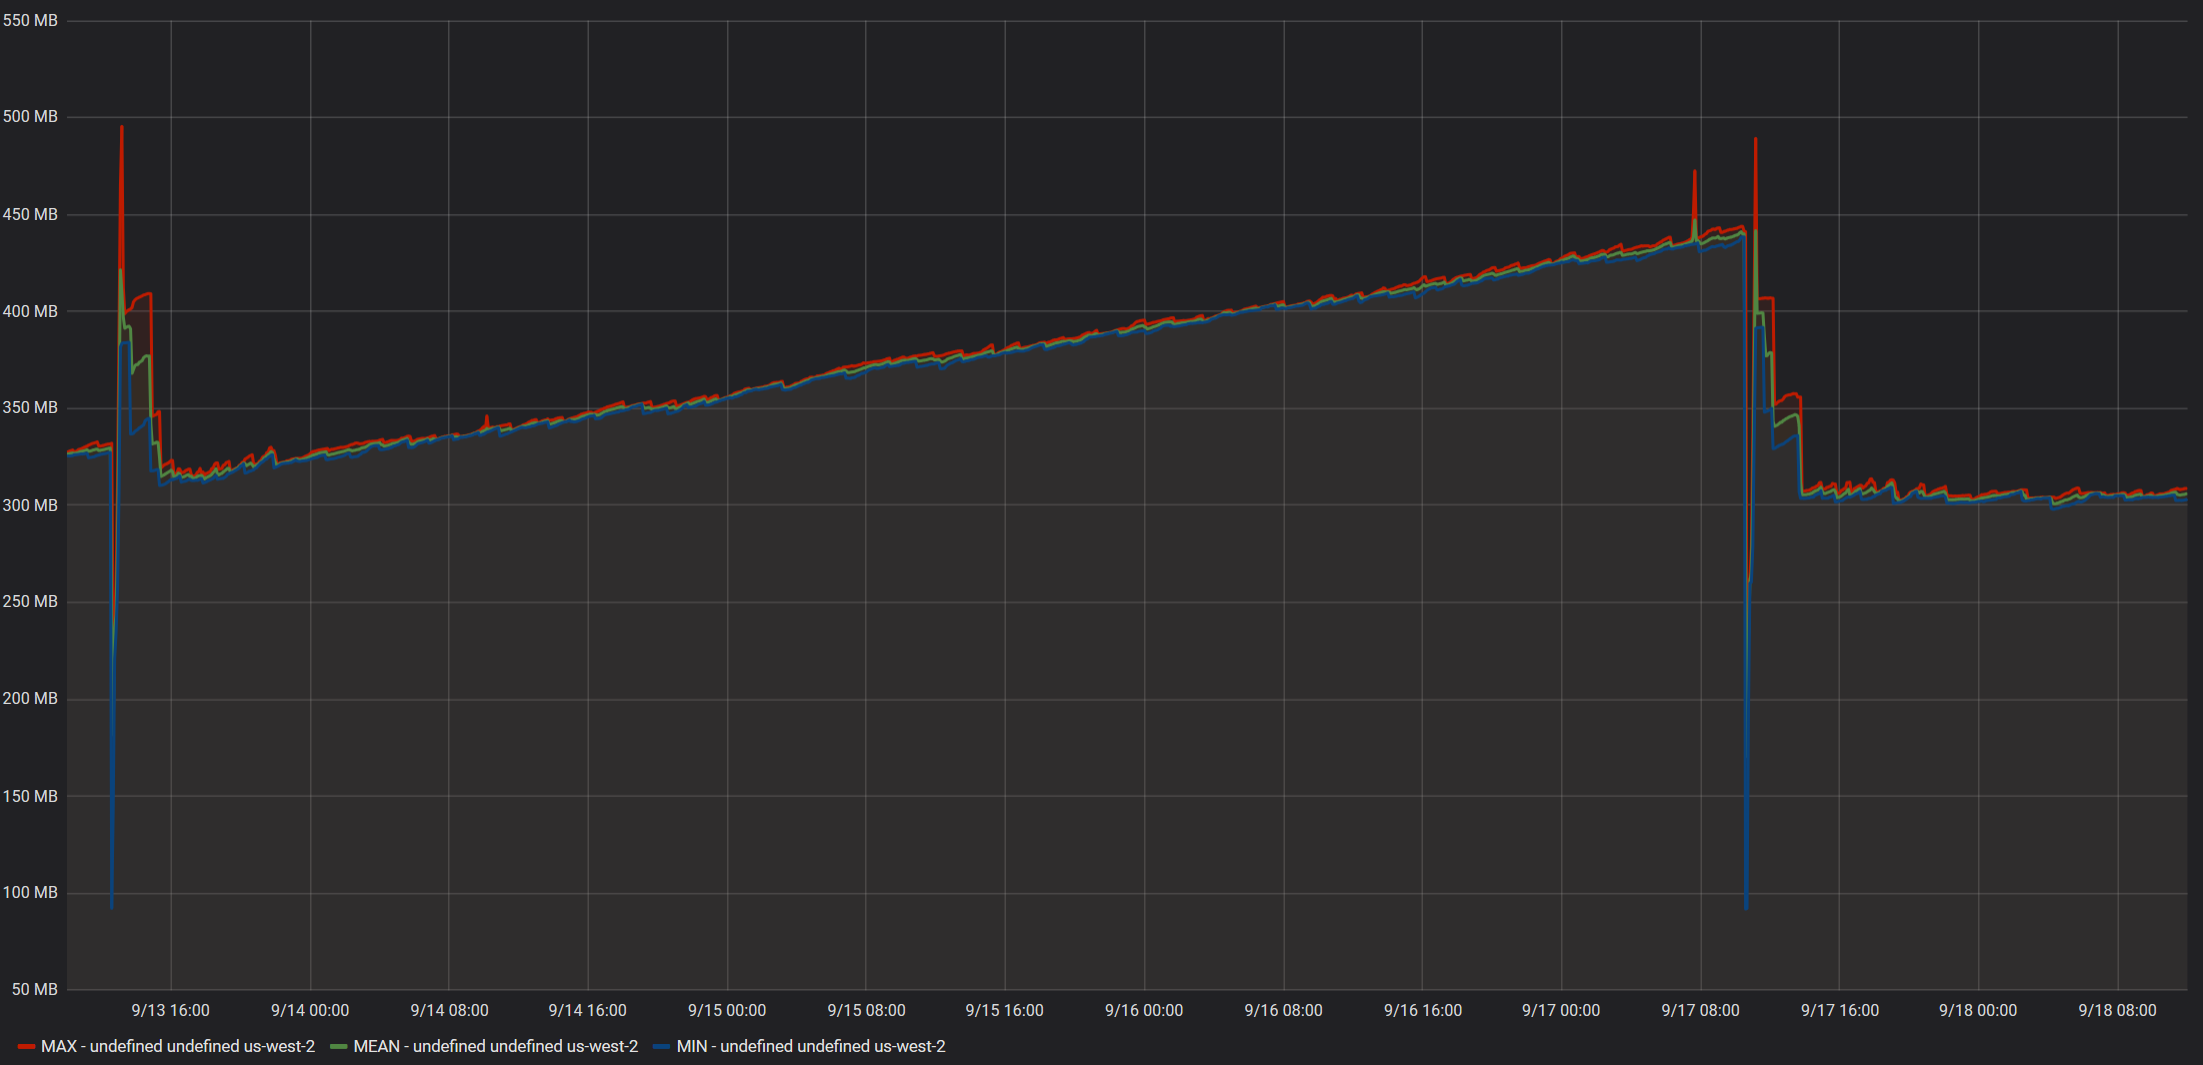
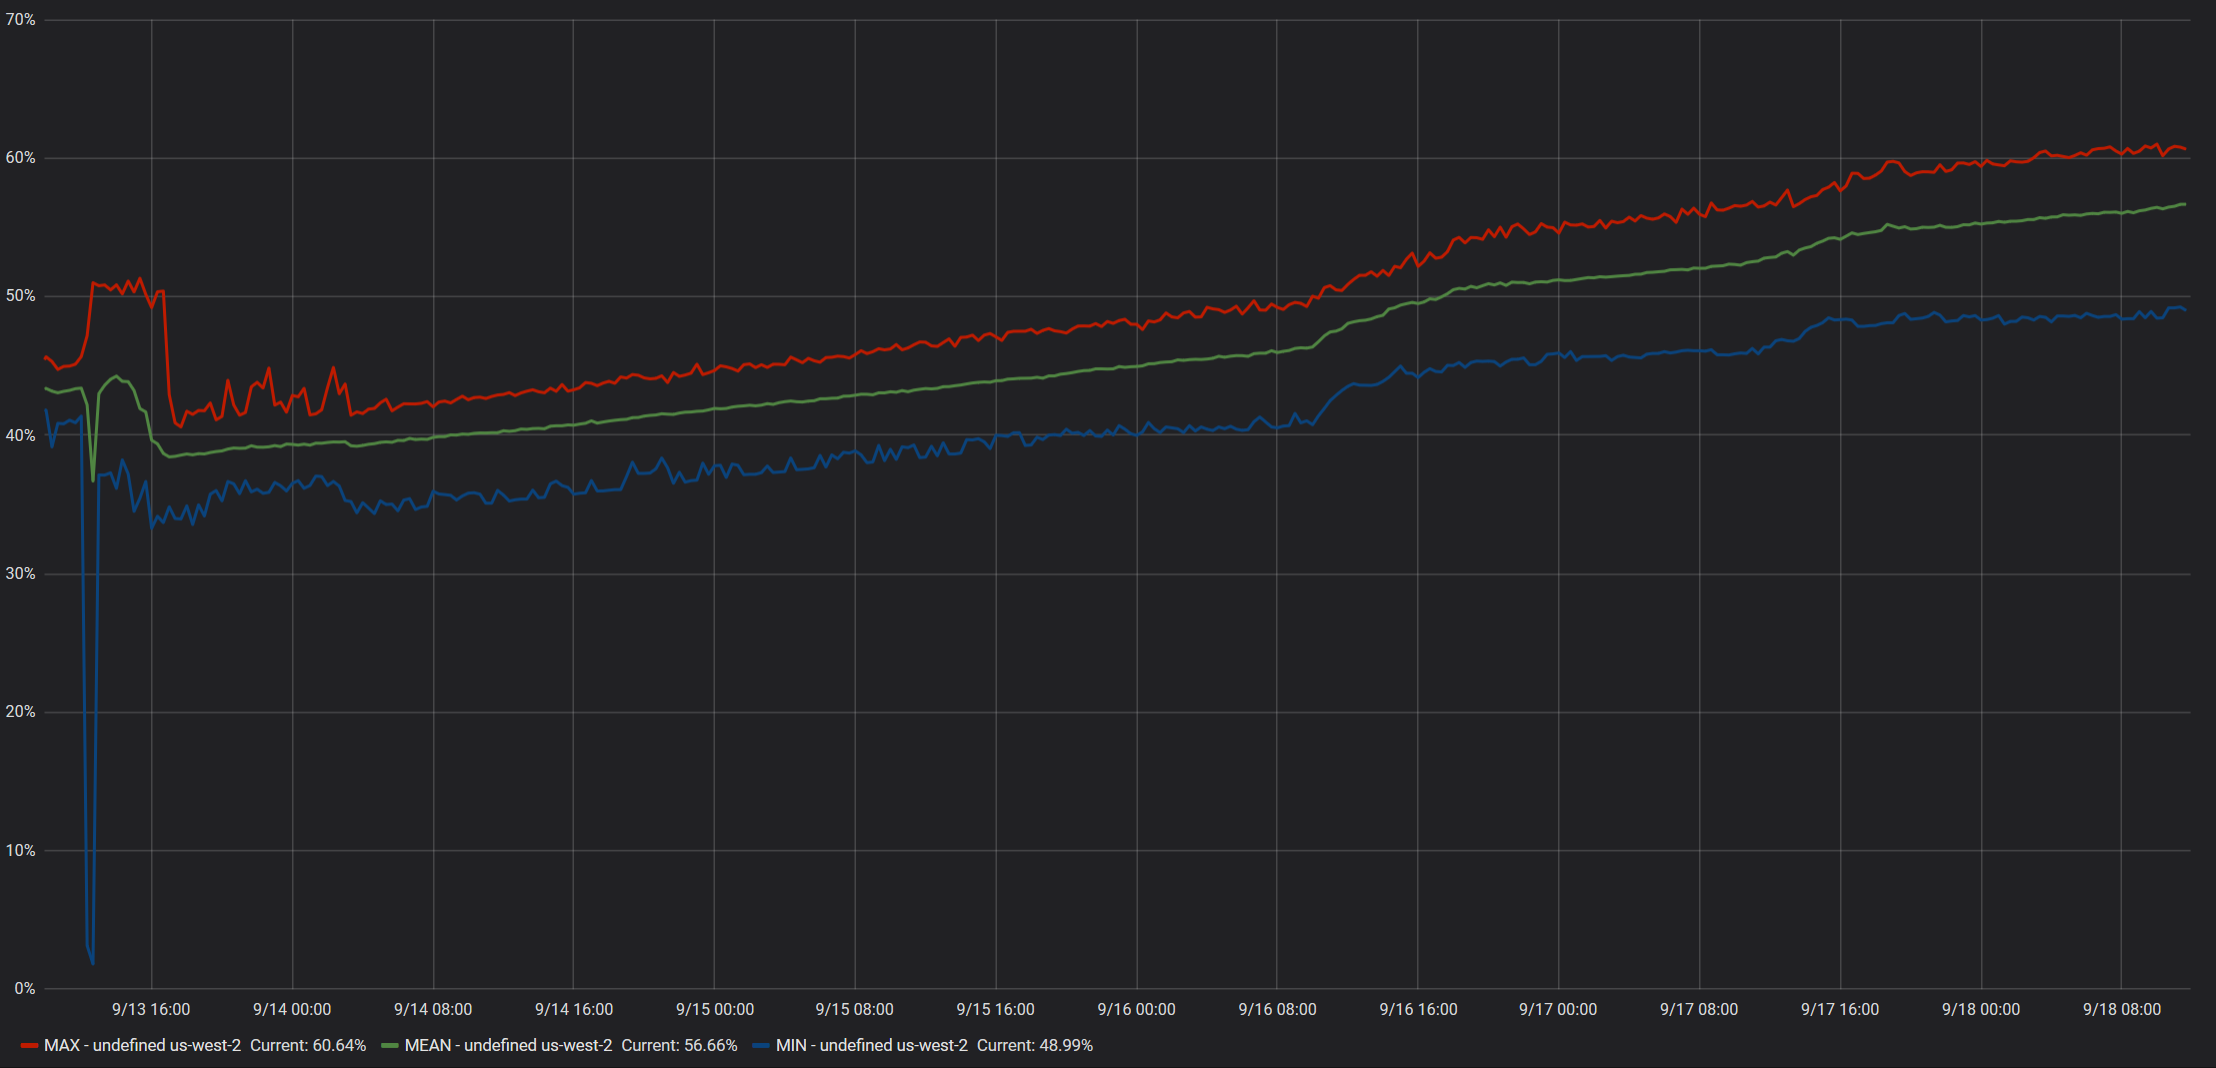
Screenshots from Idle Instance
Data reported by ECS Metrics:

Working set size reported by application:
GC Memory size reported by application:

The spike at 9/13 is when we deployed mcr.microsoft.com/dotnet/core/aspnet:2.2.7-alpine3.9
The spike at 9/17 is when we deployed mcr.microsoft.com/dotnet/core/aspnet:2.2.7-alpine
Screenshots from instance with moderate daytime load
Data reported by ECS Metrics:
Working set size reported by application:

GC Memory size reported by application:

The spike at 9/13 is when we deployed mcr.microsoft.com/dotnet/core/aspnet:2.2.7-alpine3.9
Additional context
- The docker containers are hosted on AWS EC2 Linux instances using ECS.
- No special configurations or flags are used, as in we are not setting a specific GC mode or anything of that nature.
- The containers have a defined hard memory limit set, but no CPU Units or Ulimits.
About this issue
- Original URL
- State: closed
- Created 5 years ago
- Comments: 17 (8 by maintainers)
As an update to @gnjack’s earlier comment:
We ran our repro app on
3.0.0-alpine3.8,3.1.0-preview1-alpine3.10, and3.0.0-alpine3.10(from the nightly docker image) - and none of them exhibited the same memory leak we’ve seen on3.0.0-alpine3.9!So the good news is that even if we don’t manage to diagnose the root cause of the leak, it looks like it can be avoided by sticking to alpine 3.8 for now, and rolling forward to the alpine 3.10 image (as soon as it’s stable and released).
Even though we’ve been focusing on .net core 3, I would expect .net core 2.2 would have the same behaviour.
Hi @gnjack ,
It’s unfortunate that this issue is also affecting you, but I am also glad that it’s not just me.
I have been working on a minimal repro myself, at first I tested just memory allocations, then I tested Console output ( since we log a decent amount of information to the console ), but neither of those yielded any results.
The next test I planned was outbound requests using HttpClient, and while it’s too early to say with 100% confidence, I think we have a winner!
@anurse Here is a solution that exhibits the the growing working set size: Alpine39MemoryRepro.zip
After 4 hours of runtime: Alpine 3.8’s working set size remains between 98-101MB Alpine 3.9’s working set size started at ~98 MB, and is now at 107 MB. GC Generations 0, 1 and 2 are all being collected and the managed memory has remained stable.
Usage for the repro:
docker build -t alpinememory -f .\Dockerfile-localtest .docker build -t alpinememory38 -f .\Dockerfile-localtest38 .docker run -p 5001:8080 --name alpinememory -d alpinememory( alter host port if you wish )docker run -p 5002:8080 --name alpinememory38 -d alpinememory38docker cp alpinememory:/tmp/report.csv ./report_39.csvdocker cp alpinememory38:/tmp/report.csv ./report_38.csvWhat the repro solution does:
BackgroundWorker.Worker/ReportingWorker.csruns every minute and dumps memory-related information fromProcess.andGC.namespaces to a text file, and only exists to conveniently observe memory behavior over time without requiring any additional dependenciesWorker/WebRequestWorker.csruns every second and sends a HTTPS Get to one out of 16 pre-configured URLs. It then logs the number of A or a chars in the response, pretty sure that’s unnecessary but I wanted to make sure the response content was used in some manner and nothing was optimized out.services.AddHttpClient();inStartup.cs, injectingIHttpClientFactoryand usingCreateClienton-demand.Here are my results after 4 hours: Alpine 3.9: report_39.txt Alpine 3.8: report_38.txt