deno: [node] slow npm resolution with npm binary command
Continuing to use deno everywhere, I came across one repository on my disk where running the tests is significantly slower with deno compared to node. The repository uses mocha as the testing framework.
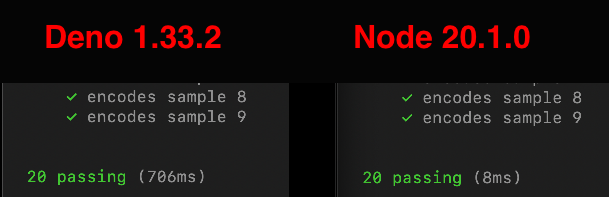
The difference is more obvious in video form:
https://user-images.githubusercontent.com/1062408/236691718-cddd7f44-8b01-49e7-8be1-a48d4b4d1ee2.mp4
My native profiling skills are a bit basic, but from what I can tell with Mac’s Instrument app is that most of the time is spent resolving and fetching npm modules.
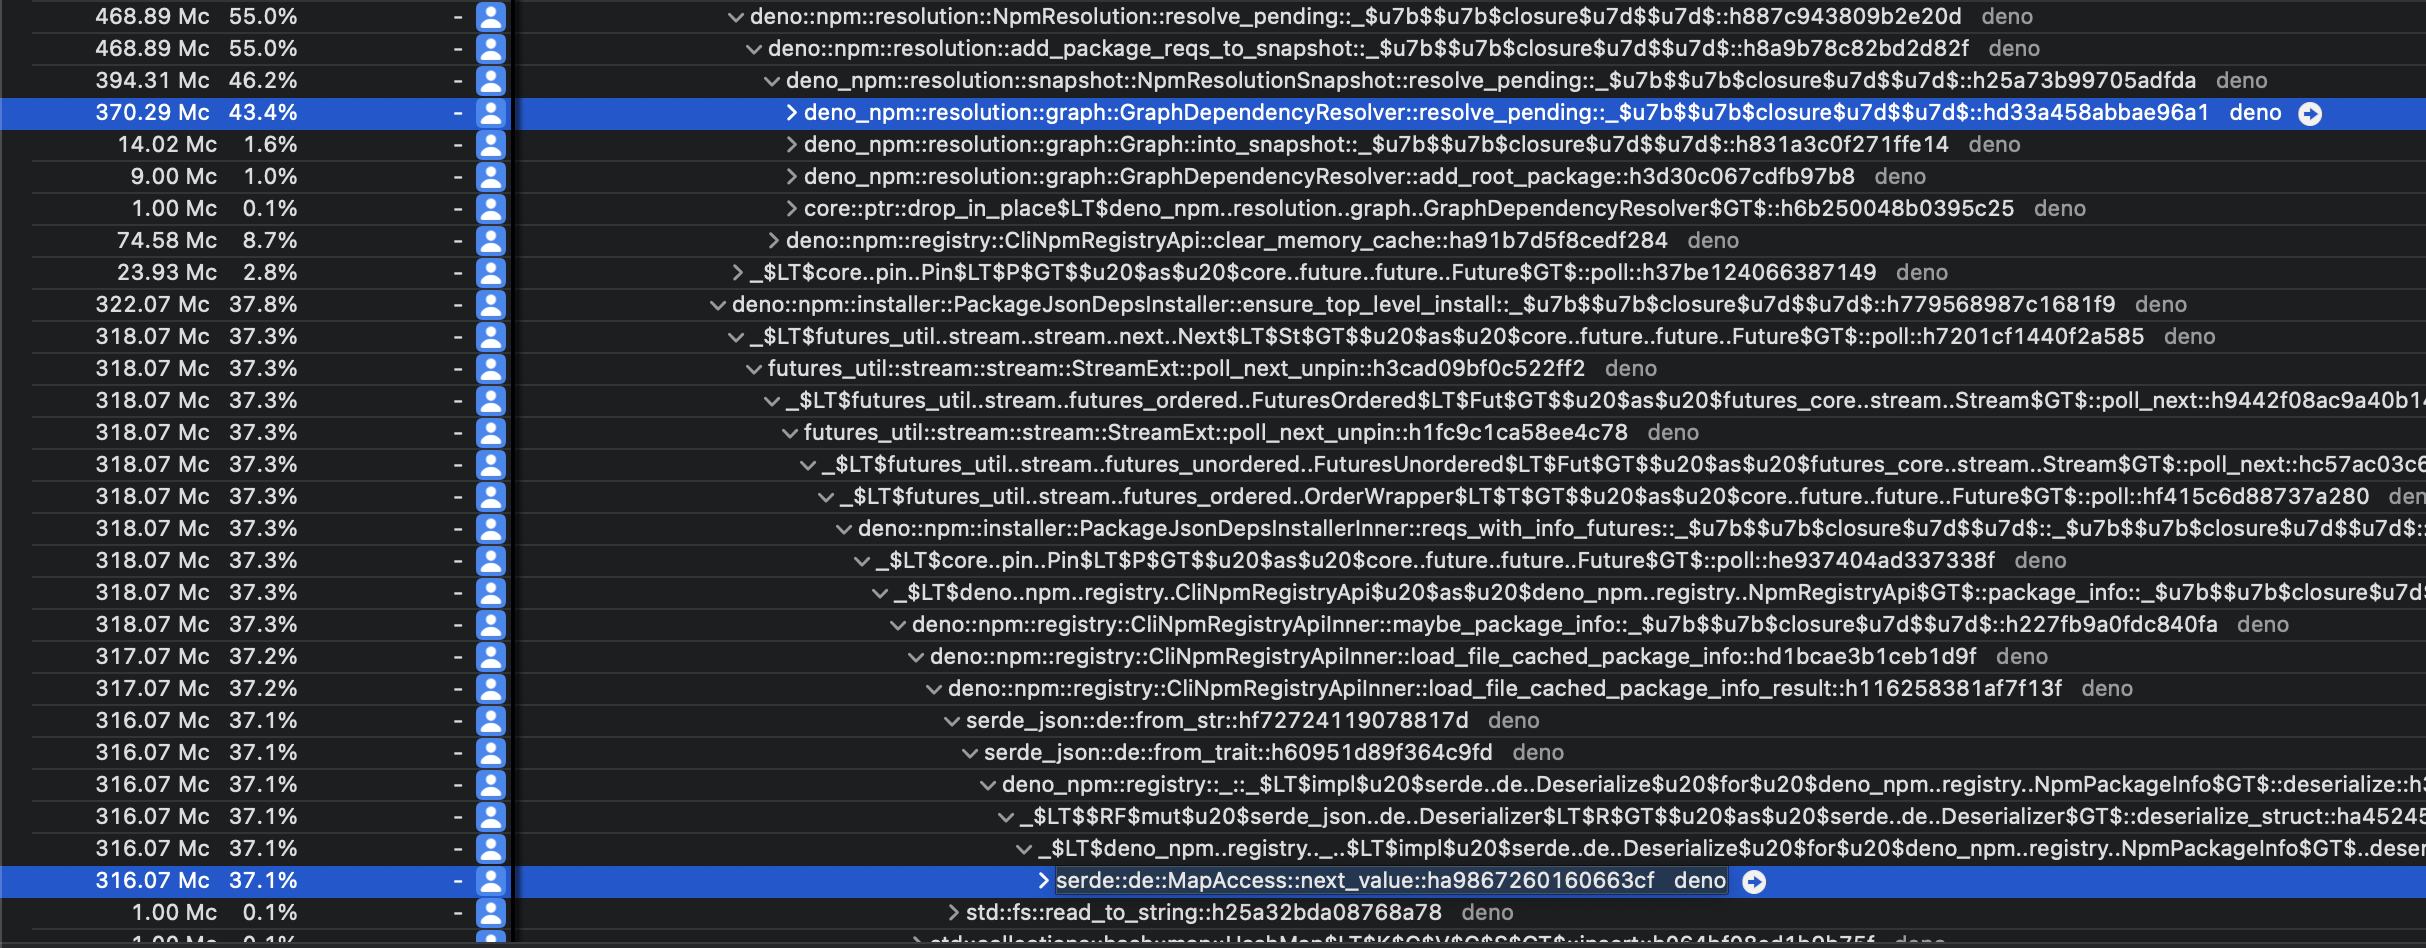
If I’m reading the trace correctly it seems like serde deserialization is very prominent.
Steps to reproduce
- Clone https://github.com/Rich-Harris/sourcemap-codec (yes that one, not the newer one, e.g. ignore the archived message)
- Run
deno task test
About this issue
- Original URL
- State: closed
- Created a year ago
- Comments: 19 (19 by maintainers)
Commits related to this issue
- fix(ext/web): improve timers resolution for 0ms timeouts (#19212) This commit changes the implementation of `ext/web` timers, by using "op_void_async_deferred" for timeouts of 0ms. 0ms timeout is... — committed to denoland/deno by bartlomieju a year ago
- fix(npm): store npm binary command resolution in lockfile (#19219) Part of #19038 Closes #19034 (eliminates the time spent re-resolving) — committed to denoland/deno by dsherret a year ago
- fix(node): make sure "setImmediate" is not clamped to 4ms (#19213) This commit changes implementation of "setImmediate" from "node:timers" module to 0ms timer that is never clamped to 4ms no matter... — committed to denoland/deno by bartlomieju a year ago
Talked to Bartek out of band. We’ll change
setImmediateto useop_void_async_deferreddirectly, bypassingsetTimeoutmachinery entirely.setTimeoutandsetIntervalthemselves will continue to clamp like browsers do to prevent runaway timers causing event loop lockups.FYI removing the “timerNextingLevel” check makes Deno run the reproduction in the same time as Node (6ms)
EDIT: Opened https://github.com/denoland/deno/pull/19213 that builds on top of #19212 but changes Node compat APIs so that they are not limited to the nesting levels clamping.
@bartlomieju here is a simplified reproduction case: https://github.com/marvinhagemeister/deno-bug-timer
deno run -A npm:mochaTo compare this with node:
npm inpx mocha@bartlomieju I can reproduce the issue reliably with both release and debug builds. The OS doesn’t seem to make a difference either. Can reproduce it on macOS, Windows 11 and WSL (Ubuntu).
The implementation of timeout is slow - Tokio limits us to 1ms resolution (which means that 0ms timeout actually takes more than 1ms), but I think I came up with a “fast path” for 0 timeout - essentially it just needs to run and the end of the current tick of the event loop, so it might not need to involve setting up a timer in Rust at all.
Good investigation @marvinhagemeister! Let’s address both
setImmediateproblem and slowprintin separate issues. I believe forsetImmediateI will need to add a special op (I can look into that), but it’s currently unclear why print take so long - effectively it ends us inop_printhere: https://github.com/denoland/deno/blob/3e03865d89e3abf0755e6d3b8305632a5319fdfe/core/ops_builtin.rs#L160-L171This is because it’s doing the npm resolution on each run—not that npm resolution is slow. Last time I measured, Deno’s resolution is faster than npm.
The way to cache the resolution and make it fast is to use a Deno lockfile, which gets automatically created if there’s a
deno.jsonin the repo. That said, for some reason the resolution is not being written even when doing this. I opened https://github.com/denoland/deno/issues/19038Side note: On Windows, running
npm run testfails because of the use ofrm, butdeno task build && deno task testworks 😄