cortex: Distributor failing with 500s for no clear reason
Describe the bug
I’m seeing random 500s when Prometheus is pushing metrics to /api/v1/push:
msg="Failed to send batch, retrying" err="server returned HTTP status 500 Internal Server Error: rpc error: code = Unavailable desc = transport is closing"
Which looks like this on the Cortex side:
msg="POST /api/v1/push (500) 281.388644ms Response: \"rpc error: code = Unavailable desc = transport is closing\\n\" ws: false; Content-Encoding: snappy; Content-Length: 32409; Content-Type: application/x-protobuf; User-Agent: Prometheus/2.26.0; X-Prometheus-Remote-Write-Version: 0.1.0; "
But it’s just a warn level message, and even with debug logs I see no reason for this error.
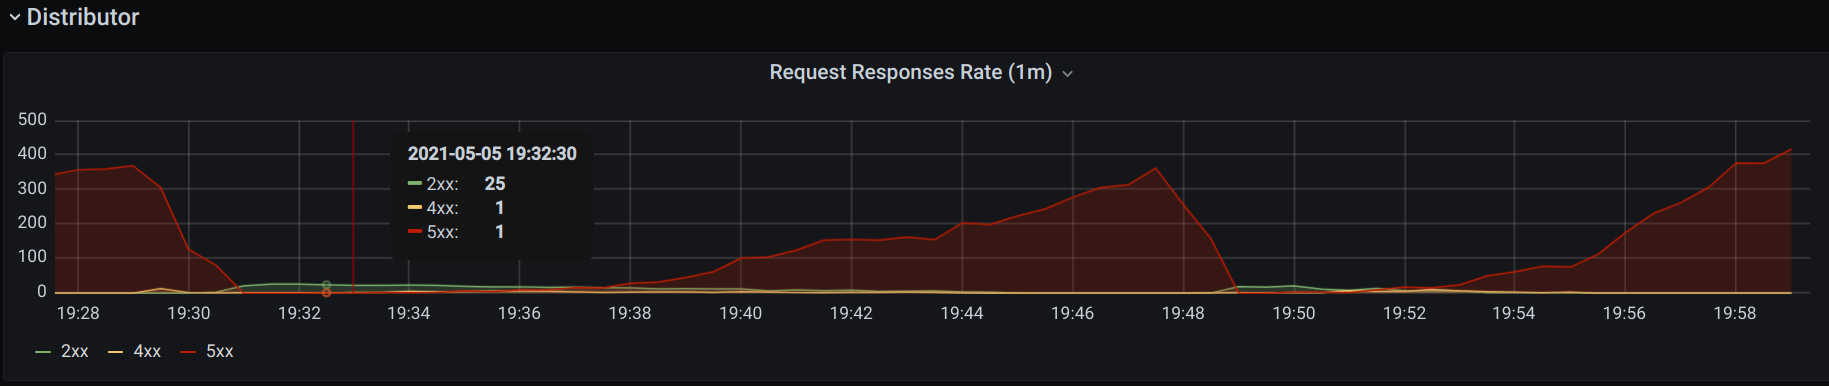
The number of samples being sent is tiny:
 > curl -s localhost:9090/metrics | grep "^prometheus_tsdb_head_series "
prometheus_tsdb_head_series 34294
And the hosts are VERY beefy and underutilized, so I’m really confused why this is happening
To Reproduce Not really sure. I’m happy to help debug this, but I’m not sure where to start.
Expected behavior
Error should include reason for 500 error, but all it contains is rpc error: code = Unavailable desc = transport is closing.
Environment:
- Infrastructure: Systemd service on Ubuntu
- Version:
1.8.0
Storage Engine
Chunks storage using Cassandra 3.11.9.
Additional Context
I started getting a LOT of 500s suddenly, so I disabled all Prometheus instances except one to debug this, but the logs give me no indication as to why it’s actually happening. When I re-enable all other Prometheus instances the 500s keep raising until they overwhelm Cortex.
About this issue
- Original URL
- State: closed
- Created 3 years ago
- Comments: 26 (26 by maintainers)
Internally Cortex uses gRPC to communicate between various components, even if those components run inside single binary.
If your Cortex cluster has very low usage, you may be running into problem described here: https://github.com/cortexproject/cortex/issues/3606#issuecomment-745179803