cloudnative-pg: Replication lag metric seems to be broken in 1.19.1
After updating from 1.19.0 to 1.19.1 I have constant alarms for cnpg_pg_replication_lag metric for all my db clusters. Restarting cluster resets metric back to zero and then it starts to grow again:
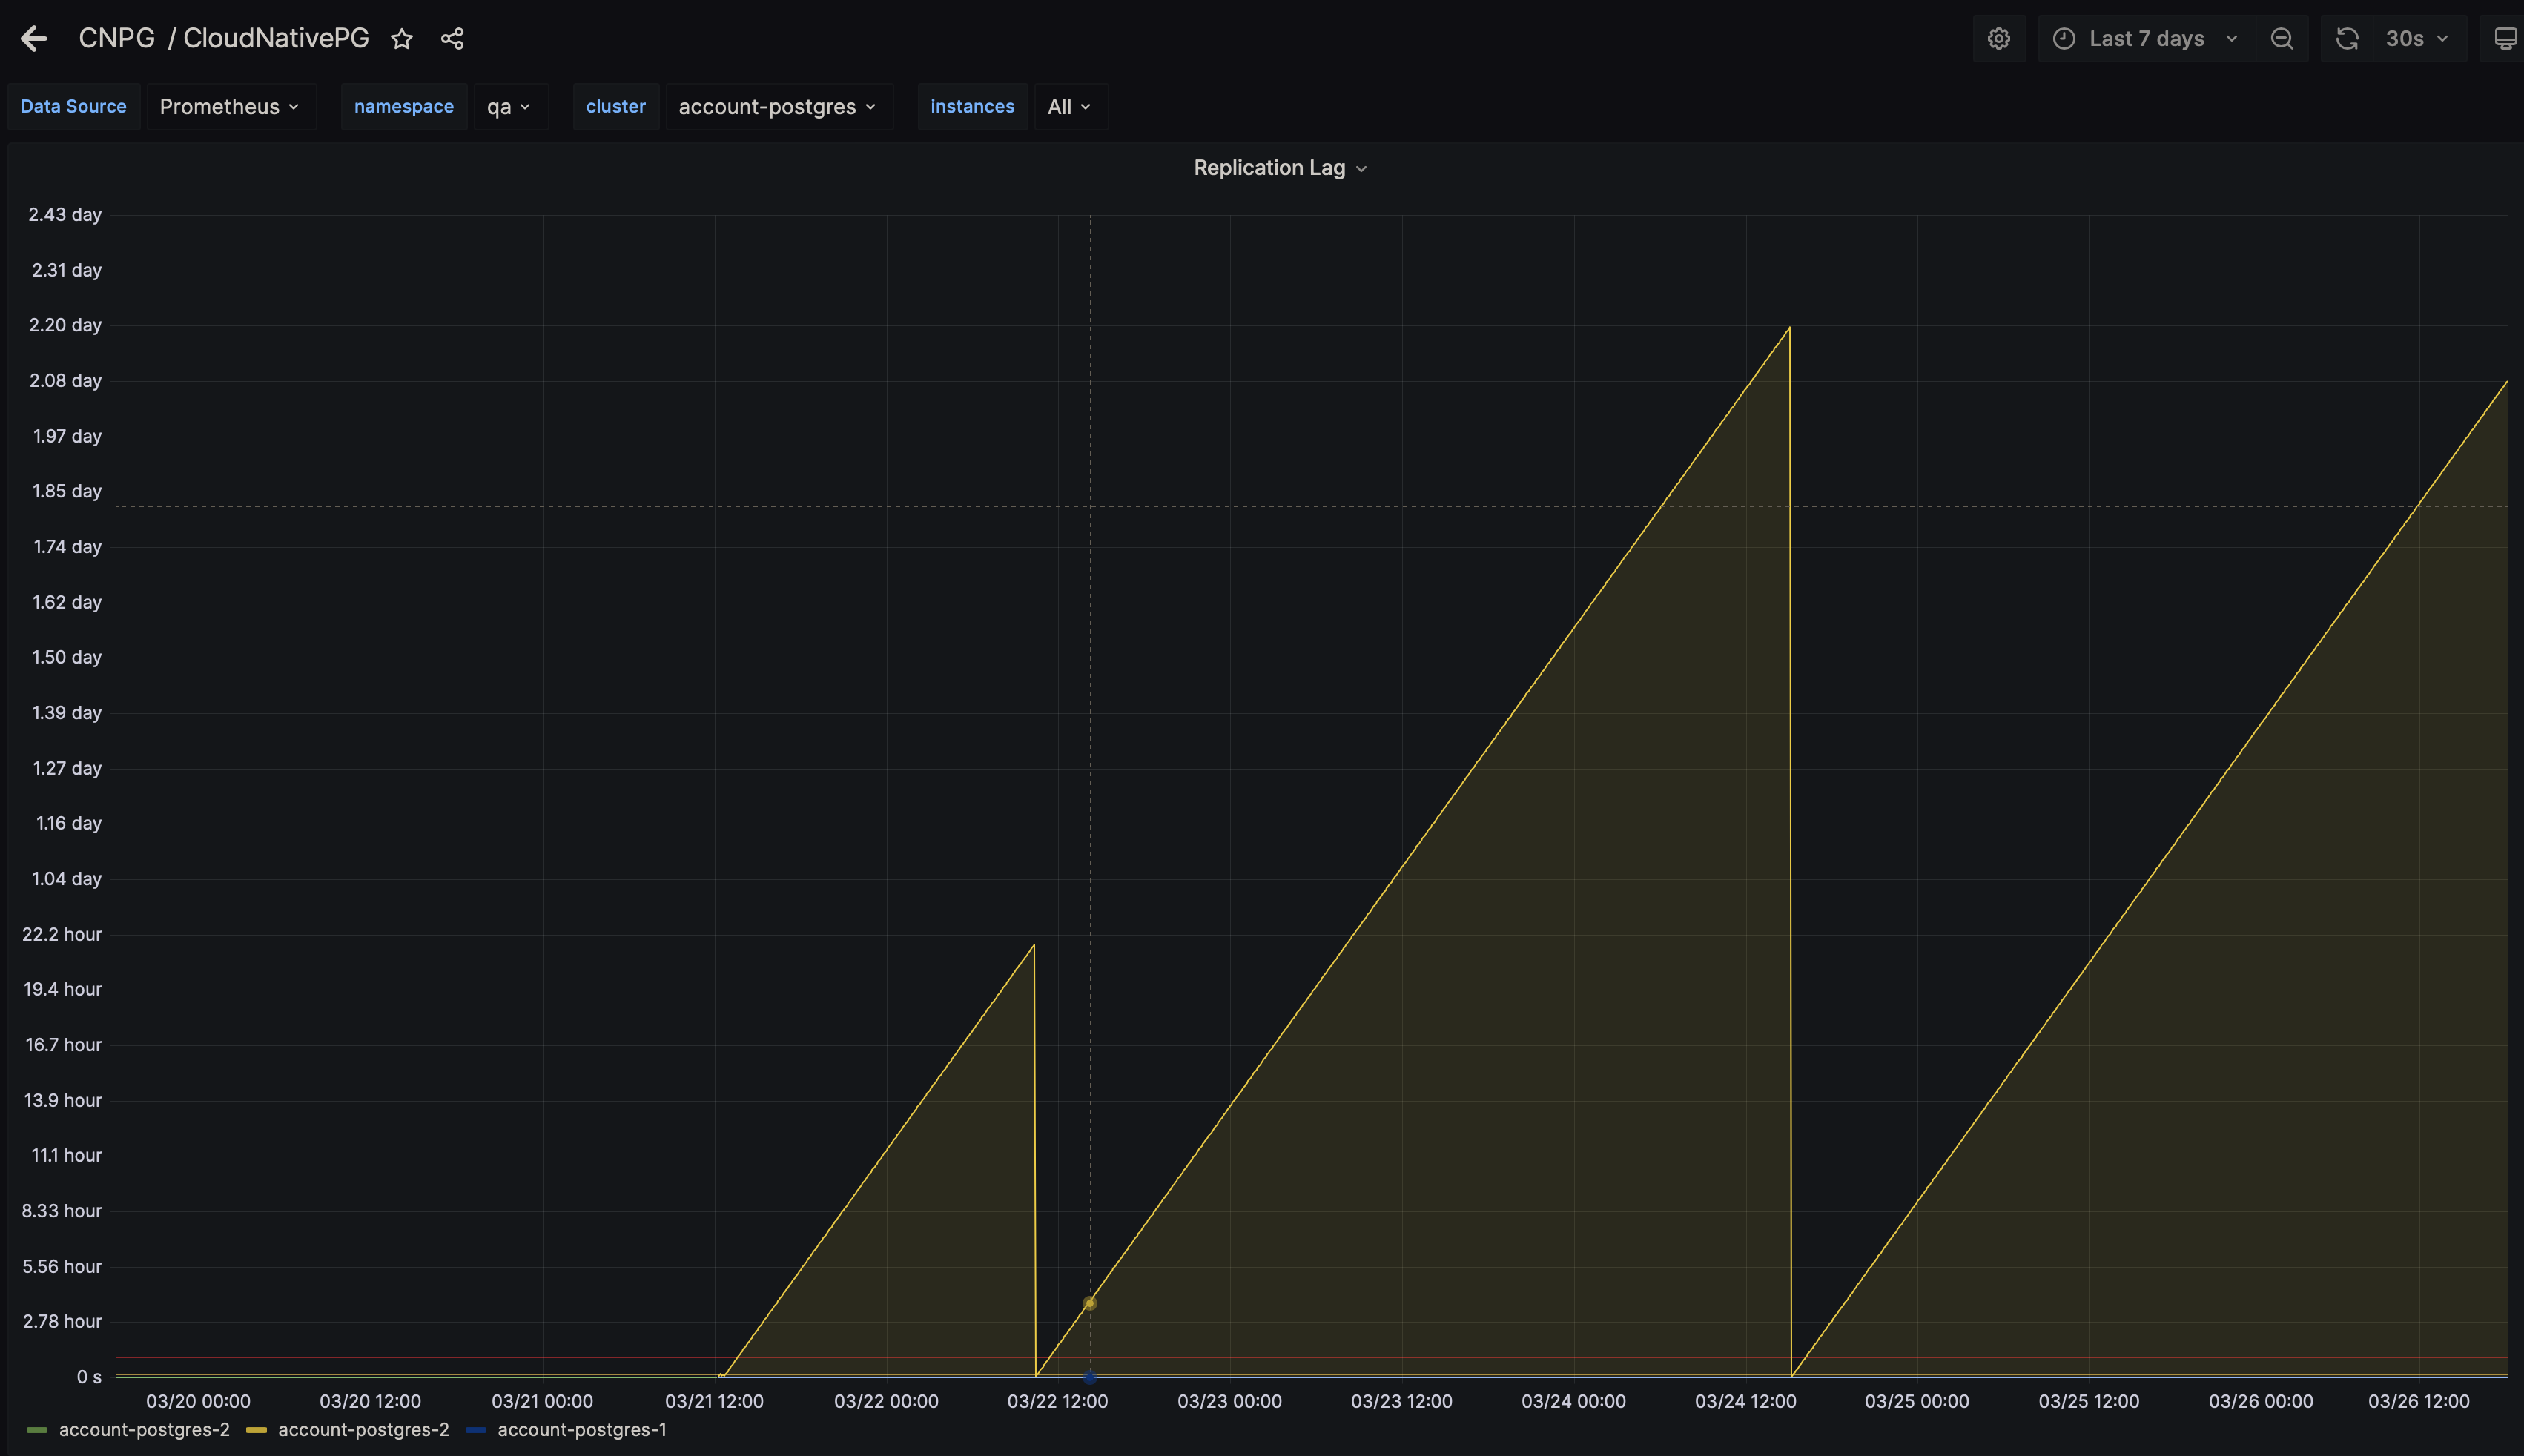
and unless I’m misreading this - status shows cluster in a perfectly synchronized state:
kubectl cnpg status account-postgres
Cluster Summary
Name:               account-postgres
Namespace:          qa
System ID:          7175972819327348754
PostgreSQL Image:   ghcr.io/cloudnative-pg/postgresql:14.3
Primary instance:   account-postgres-1
Status:             Cluster in healthy state
Instances:          2
Ready instances:    2
Current Write LSN:  2/1A000000 (Timeline: 9 - WAL File: 000000090000000200000019)

Certificates Status
Certificate Name              Expiration Date                Days Left Until Expiration
----------------              ---------------                --------------------------
account-postgres-ca           2023-06-02 21:10:31 +0000 UTC  68.25
account-postgres-replication  2023-06-02 21:10:31 +0000 UTC  68.25
account-postgres-server       2023-06-02 21:10:31 +0000 UTC  68.25

Continuous Backup status
First Point of Recoverability:  2023-02-24T00:00:09Z
Working WAL archiving:          OK
WALs waiting to be archived:    0
Last Archived WAL:              000000090000000200000019   @   2023-03-26T00:05:11.121184Z
Last Failed WAL:                -

Streaming Replication status
Name                Sent LSN    Write LSN   Flush LSN   Replay LSN  Write Lag  Flush Lag  Replay Lag  State      Sync State  Sync Priority
----                --------    ---------   ---------   ----------  ---------  ---------  ----------  -----      ----------  -------------
account-postgres-2  2/1A000000  2/1A000000  2/1A000000  2/1A000000  00:00:00   00:00:00   00:00:00    streaming  async       0

Unmanaged Replication Slot Status
No unmanaged replication slots found

Instances status
Name                Database Size  Current LSN  Replication role  Status  QoS         Manager Version  Node
----                -------------  -----------  ----------------  ------  ---         ---------------  ----
account-postgres-1  34 MB          2/1A000000   Primary           OK      BestEffort  1.19.1           ip-10-20-26-37.us-west-1.compute.internal
account-postgres-2  33 MB          2/1A000000   Standby (async)   OK      BestEffort  1.19.1           ip-10-20-26-37.us-west-1.compute.internal
I’m happy to provide any extra information if needed.
About this issue
- Original URL
- State: closed
- Created a year ago
- Reactions: 2
- Comments: 17 (7 by maintainers)
Commits related to this issue
- fix(monitoring): improve accuracy of replica lag Fix the `pg_replication` metric to use the `pg_last_wal_receive_lsn()` and `pg_last_wal_replay_lsn()` functions to better estimate the lag of a replic... — committed to cloudnative-pg/cloudnative-pg by gbartolini 10 months ago
- fix(monitoring): improve accuracy of replica lag Fix the `pg_replication` metric to use the `pg_last_wal_receive_lsn()` and `pg_last_wal_replay_lsn()` functions to better estimate the lag of a replic... — committed to cloudnative-pg/cloudnative-pg by gbartolini 10 months ago
- fix(monitoring): improve accuracy of replica lag (#2744) Fix the `pg_replication` metric to use the `pg_last_wal_receive_lsn()` and `pg_last_wal_replay_lsn()` functions to better estimate the lag o... — committed to cloudnative-pg/cloudnative-pg by gbartolini 10 months ago
- fix(monitoring): improve accuracy of replica lag (#2744) Fix the `pg_replication` metric to use the `pg_last_wal_receive_lsn()` and `pg_last_wal_replay_lsn()` functions to better estimate the lag of ... — committed to cloudnative-pg/cloudnative-pg by gbartolini 10 months ago
- fix(monitoring): improve accuracy of replica lag This patch overrides the previous patch which only covered the documentation samples. From a deeper analysis, we noticed that some examples had alread... — committed to cloudnative-pg/cloudnative-pg by gbartolini 10 months ago
- fix(monitoring): improve accuracy of replica lag This patch overrides the previous patch which only covered the documentation samples. From a deeper analysis, we noticed that some examples had alread... — committed to cloudnative-pg/cloudnative-pg by gbartolini 10 months ago
- fix(monitoring): improve accuracy of replica lag This patch overrides the previous patch which only covered the documentation samples. From a deeper analysis, we noticed that some examples had alread... — committed to cloudnative-pg/cloudnative-pg by gbartolini 10 months ago
- fix(monitoring): improve accuracy of replica lag (#2750) This patch overrides the previous patch which only covered the documentation samples. From a deeper analysis, we noticed that some examples ... — committed to cloudnative-pg/cloudnative-pg by gbartolini 10 months ago
- fix(monitoring): improve accuracy of replica lag (#2750) This patch overrides the previous patch which only covered the documentation samples. From a deeper analysis, we noticed that some examples ha... — committed to cloudnative-pg/cloudnative-pg by gbartolini 10 months ago
- fix(monitoring): improve accuracy of replica lag (#2744) Fix the `pg_replication` metric to use the `pg_last_wal_receive_lsn()` and `pg_last_wal_replay_lsn()` functions to better estimate the lag o... — committed to cloudnative-pg/cloudnative-pg by gbartolini 10 months ago
- fix(monitoring): improve accuracy of replica lag (#2750) This patch overrides the previous patch which only covered the documentation samples. From a deeper analysis, we noticed that some examples ... — committed to cloudnative-pg/cloudnative-pg by gbartolini 10 months ago
Tested on my cluster, it works 😉
I think the query should look like this:
With the
pg_last_wal_receive_lsn() = pg_last_wal_replay_lsn()comparison we confirm that there’s no lag if receive and replay LSN are the same value.Doesnt the stat track replication lag to replicas, so yes this is the solution?
Really hoping so because until finding this today ive spent the last few months staring at databases that all appear to be clones of eachother, getting told theyre not replicating, and questioning reality 😄
@sxd I haven’t tried latest dev, but for me fix is to simply set
primary: truein monitoring configmap here: https://github.com/cloudnative-pg/charts/blob/8fe6dee4e7966ca474d33f0769d2207a38befb96/charts/cloudnative-pg/values.yaml#LL243C8-L243C8Not sure why primary was removed from there in chart or what latest updates could fix it but will try to find some time to test latest dev without that config. Though it seems to me that easier fix would be to revert this change in helm chart. Should I perhaps create another issue in chart repo instead of current one?
@mnencia I was able to track this to following chart update - replication lag query used to run on primary.
Not sure what was the reason to remove primary flag, but judging by this and this it seems to me that replication lag query has to run on primary? I’m not familiar with postgres replication internals but I believe if alarm is on for idle cluster which looks perfectly replicated otherwise - it must be wrong.
for now I’ll simply add
primary: trueback to monitoring configmap but could it be reverted back in chart values? I’d rather avoid adding whole monitoring block to values override in my gitops repo.The default lag metric is based on the difference from the last visible commit to the current time. It looks like your cluster is idle, so the metric is unreliable.