perses: Replica propagation times systematically change in cyclic patterns that may slow simulations
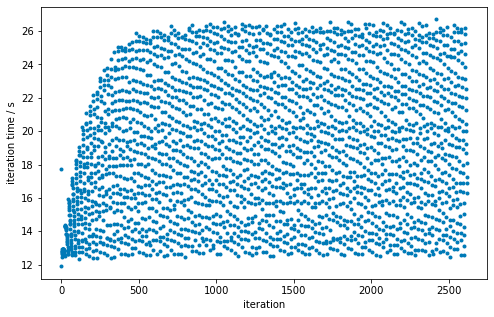
In plotting the total replica propagation time per iteration from one of @hannahbrucemacdonald’s experiments (/data/chodera/brucemah/relative_paper/dec/jnk1/lig20to8/complex_0.stderr), it appears that there is a pattern:
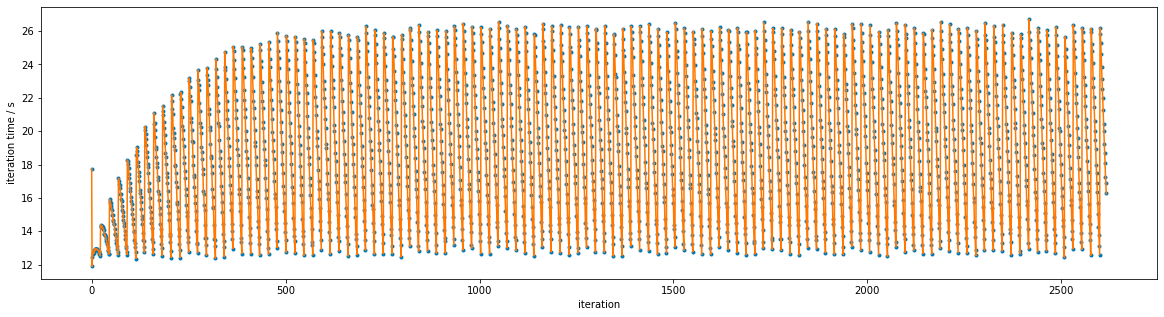
 Connecting successive iterations with lines reveals a clearer pattern:
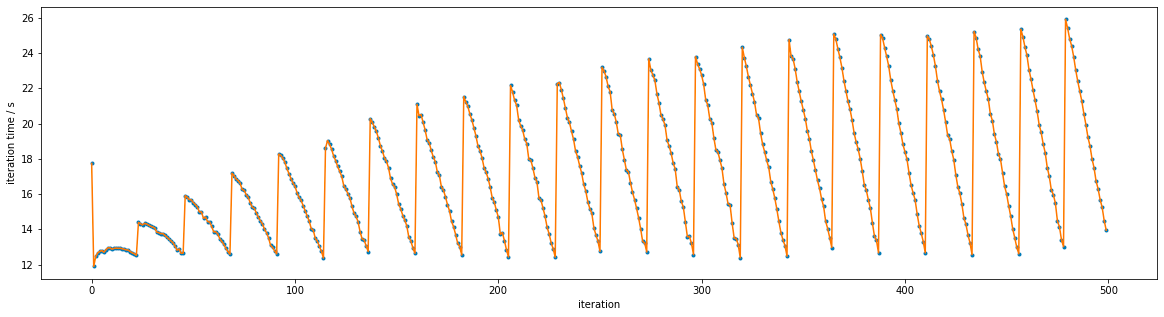
 Zooming in shows the pattern more clearly:
 This is currently just something intriguing, but something we should investigate in the new year since it may lead to speed improvements if we can understand what is going on here.
About this issue
- Original URL
- State: closed
- Created 5 years ago
- Comments: 133 (99 by maintainers)
Commits related to this issue
- Using LangevinDynamicsMove instead of LangevinSplittingDynamicsMove closes #613 — committed to choderalab/perses by hannahbrucemacdonald 4 years ago
- Removing LangevinDynamicsMove as didn't fix issue #613 — committed to choderalab/perses by hannahbrucemacdonald 4 years ago
Here’s a clue: If I replace the
mcmc_moves—which areLangevinDynamicsSplittingMoves—withLangevinDynamicsMoves, the periodic behavior goes away.I suggest we may want to use
LangevinDynamicsMovefor now and I can debug the MCMCLangevinDynamicsSplittingMovestuff separately. It may have to do with theLangevinSplittingIntegrator, which @maxentile and I need to refine anyway.I think I understand part of what’s going on. I don’t know exactly what’s leading to the specific sawtooth shape we’re seeing. I think it relates to the details of the sampling algorithm, which I’m not familiar with. I’ll explain what I’ve found, and then maybe you’ll be able to fill in the missing pieces.
First some background on how OpenMM computes nonbonded interactions. It uses a coarse-grained neighbor list. Instead of finding the neighbors of individual atoms, it finds the neighbors of blocks of 32 contiguous atoms. This is only efficient if those blocks are compact. Atoms whose indices are close also need to be close in space. That’s fine for proteins, since the atoms are in sorted order by residue. But water is a problem. Each molecule can diffuse independently of every other.
To address that, it sorts the water molecules in a way that groups spatially nearby ones close together in order. That makes the neighbor list efficient. But it becomes less efficient with time as the waters move, so it periodically repeats the sorting.
In this script, a single Context is used for 24 replicas. It loops over them, setting the coordinates for each replica in turn and running just a small number of time steps with it. That means it is frequently simulating one replica with a water ordering that was created for a different replica, and hence is inefficient. Within a few hundred steps it will reorder them and become efficient again. But then it promptly switches to yet another replica.
That’s what seems to be going on. When the iteration time goes up, it’s because the neighbor list has become less efficient and it has to compute more interactions. And if I make it reorder atoms more often, the variation gets smaller (though of course it also has to spend more time sorting atoms).
Triggering the reordering of atoms does work around the issue. I tried what @jchodera suggested in this comment and the results are as follow. Sorry for the crowded plot but I think it’s readable enough. The ones labeled with “fix” are the ones with the change, the impact on performance is not too much, and it’s also better if we use the
UseBlockingSync: falseoption (maybe we should make this the default?).The localbuild is openmm at the commit @zhang-ivy pointed in a previous comment, which corresponds to her environment and to the
openmm-7.7.0-dev1package atconda-forge.I implemented the logic described above in https://github.com/choderalab/perses/issues/613#issuecomment-1199622533. It mostly works, but it ends up having unintended consequences. Every time the barostat runs, it triggers a call to
setPositions(), which means reordering gets done much more often before. I could work around that, but I think it would be good to consider other approaches as well. For example, I’m thinking about a method that would monitor the size of the neighbor list and trigger a reordering whenever it sees the neighbor list has grown too much. The goal is to find something robust that will automatically do the right thing in nearly all cases.Ok, thanks. I think the behavior we want is something like this.
setPositions(), and then immediately follow with a call tostep(), we should immediately perform reordering. If you take one step, you’re probably going to take lots of steps.setPositions()and thengetState(), we should not do reordering. You may only intend a single evaluation with those coordinates.setPositions(). If you followgetState()withstep(), at that point we should immediately do reordering.setPositions(), we should maintain the current behavior. Lots of classes update positions in other ways through internal APIs, but usually only for small changes to the positions.I think the important distinction is whether all the threads end up using the same OpenMM Context object, or whether each one ends up using a different Context. Does that match what you see? You can verify whether they’re the same or different by printing out
hash(context)for each one.You can time everything happening inside the integrator step in the same way. Just inside the start of this loop add the line
And then here just before
step = nextStep(not after!) add the linesThat will give you a time for executing every step of the integration algorithm.
stepTypewill be one of the enumerated constants at https://github.com/openmm/openmm/blob/f477b106fc946c4cb3b4ae7d61da43889e568c9e/openmmapi/include/openmm/CustomIntegrator.h#L344-L381. You can also time the final section of the method where it callsrecordChangedParameters()andreorderAtoms()to be thorough.@ijpulidos : Is there a way to measure how long is spent in the
reorderAtoms()step, and how many times it is called, without recompiling? Are you able to profile using the nightly OpenMM builds which have debug symbols built in?Here’s what I’ve found so far:
modprobe nvidia NVreg_RegistryDwords="RMForcePstate=0") to force into P0:Edit: It appears that this is described as an option for the windows-only nvidiaInspector, but the above presents a way to do this in linux.
Cool thanks - I’ll look into
Hopefully there is some more output in
/data/chodera/brucemah/relative_paper/amber_starting/off100/thrombin/test/SLOWER1to10for you to see in the AM!