caddy: Potential Memory Leak - total_inactive_file grows unbounded
When running caddy as a reverse proxy via docker for a websocket server, according to top, ram that is consumed is never returned. This is especially apparent when doing a load test.
System Info:
- Azure VM - Ubuntu 18.04
- docker version 20.10.6
- Any recent caddy image (tags:
alpine,latest,2)
Here is a screenshot of top ~8 hours after performing a load test of 10,000 websocket connections for 10 minutes

Investigating it further, if you run cat /sys/fs/cgroup/memory/docker/<container hash>/memory.stat, you can see that total_inactive_file accounts for the majority of the memory reported by top.
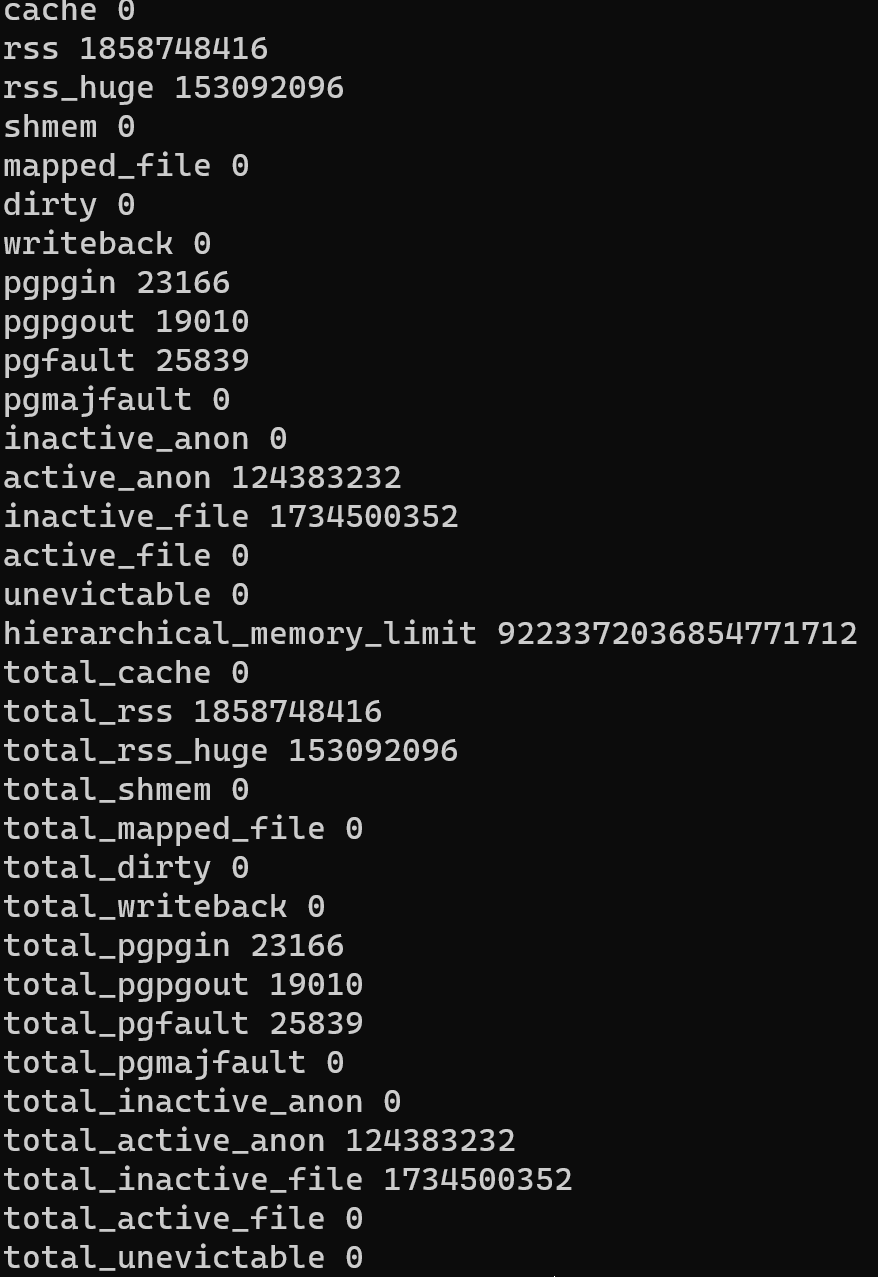
According to that screenshot, total_inactive_file grows to ~1.7gb.
If you run docker stats, which subtracts inactive files from the memory usage, it reports ~125 mb of memory used.
I am not a linux expert by any means, but after reading about total_inactive_file, it seems like this is part of a page cache that could be reclaimed by the system if it needed it.
Still, I am worried as it is the only container in my system that grows the inactive file count.
Is this something I should be worried about? Any insights as to why caddy grows like this, but the 10+ other containers (redis, databases, api servers, etc) I am using do not exhibit this behavior?
Thanks so much for providing caddy to the community. Auto HTTPS is invaluable, and I am hoping to use caddy as an nginx replacement in a variety of projects 😃
About this issue
- Original URL
- State: closed
- Created 3 years ago
- Comments: 17 (11 by maintainers)
@michaelperel I’m glad it helped. No worries! It took me some digging to find this out, too. The issue should not be there with Caddy 2.4.0 anymore (if it’s built with Go 1.16) as this changed in 1.16 to release memory back to the system quicker. Otherwise monitoring systems may falsely report high memory consumption even though it’s perfectly normal.
@michaelperel One thing you could try: reproduce your situation and then try to fill up RAM using a different application. If Go 1.15
MADV_FREEbehavior is still active, the memory usage should go down as other applications need it. I have seen this happen on other Go apps as well. Also found this (not sure how much it helps, though): https://www.bwplotka.dev/2019/golang-memory-monitoring/EDIT: also, you might want to try specifying the env variable
GODEBUG=madvdontneed=1for Caddy <=2.3.xI just got it running, will investigate more this week hopefully. Thanks for the good test repo.
@mholt I have just made a minimal example without docker. The README contains the step by step examples necessary to run and recreate the problem.
I cannot find any leak.
Letting it run for 1-4 minutes seems like a leak, because resource usage is ramping up. But as connections time out and get closed, resources are deallocated.
I wired up the heck out of this thing for observation and let it run for over an hour, multiple times. (I also shortened the chat client’s timeouts to 30s instead of 1m.) Here is one such run, and all were like this:
The load program counted 100,000+ connections during these trials.
When looking at
localhost:2019/debug/pprof, I can see allocations and goroutines both properly ramp up and then steady out when refreshing every few minutes. I also added lots of extra debug logs for the experiments and can see that all connections are closed properly, and buffers are returned to pools or cleaned up by the GC.Both my system monitor and netdata also report steady memory and FD usage over time.
I am not sure what the metric you are looking at comes from exactly, but it might be an artifact of the container more than the Caddy process.
Going to close this as a non-issue, or at least not a Caddy issue, but feel free to continue the discussion as needed.
Thanks, will look at this as soon as I have a chance