bokeh: [BUG] Behaviour of automated padding for ranges is inconsistent
Exists in Bokeh from 0.13.0 till 1.4.0 Tested on Windows 10 and Ubunto 16.0, on Firefox and Chrome (most recent versions).
That’s the weird bug, so explanation will be rather long.
Example 1:
from bokeh.plotting import figure, output_file, show

x = [0.1, 0.5, 1.0, 1.5, 2.0, 2.5, 3.0]
y1 = [30 for xx in x]

legend_items = []
p = figure(plot_width=500, plot_height=400)
l1 = p.line(x, y1, line_width=2, color='red')
p.y_range.start = 0
li1 = LegendItem(label='Line 1', renderers=[l1])
legend_items.append(li1)
legend = Legend(items=legend_items, location=(0, -30))
legend.click_policy = "hide"
p.add_layout(legend, 'left')

show(p)
That produces pretty looking chart:
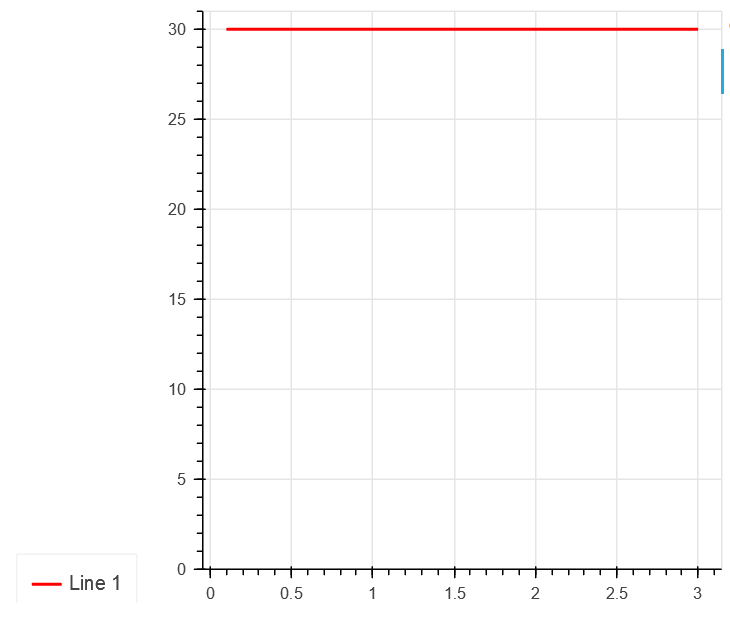
Automatic padding added a little bit of space between horizontal line and top end of the chart, so line is clearly visible.
Example 2:
from bokeh.plotting import figure, output_file, show

x = [0.1, 0.5, 1.0, 1.5, 2.0, 2.5, 3.0]
y1 = [300 for xx in x]

legend_items = []
p = figure(plot_width=500, plot_height=400)
l1 = p.line(x, y1, line_width=2, color='red')
p.y_range.start = 0
li1 = LegendItem(label='Line 1', renderers=[l1])
legend_items.append(li1)
legend = Legend(items=legend_items, location=(0, -30))
legend.click_policy = "hide"
p.add_layout(legend, 'left')

show(p)
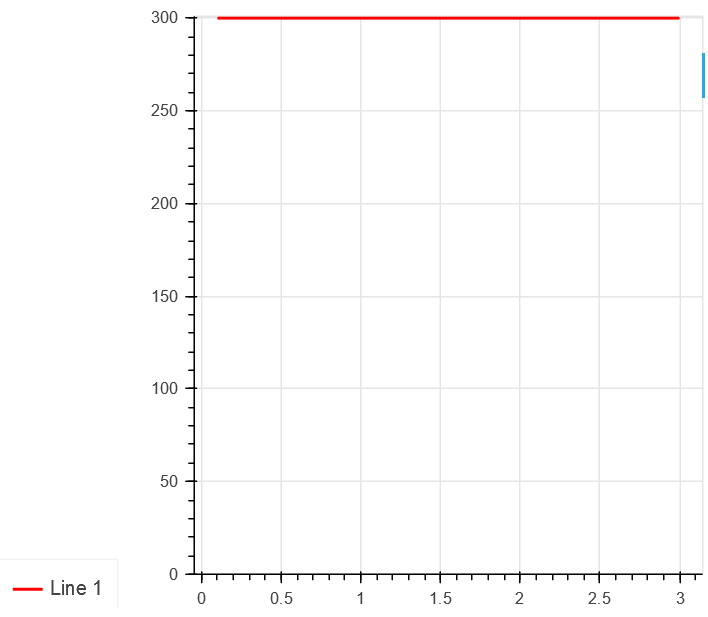
With line located at Y=300, there’s no automatic padding added, so line located directly on the border of the chart.
One can argue, it can be easily fixed bu using customized y_range, but manually setting y_range bounds makes it hard to use new feature from 1.4.0 (https://github.com/bokeh/bokeh/issues/9144):
Example 3 (only works in Bokeh 1.4.0):
from bokeh.plotting import figure, output_file, show

x = [0.1, 0.5, 1.0, 1.5, 2.0, 2.5, 3.0]
y1 = [30 for xx in x]
y2 = [60 for xx in x]
y3 = [90 for xx in x]

legend_items = []

# create a new plot with a log axis type
p = figure(plot_width=500, plot_height=400)

l1 = p.line(x, y1, line_width=2, color='red')
l2 = p.line(x, y2, line_width=2, color='blue')
l3 = p.line(x, y3, line_width=2, color='green')

p.y_range.start = 0

li1 = LegendItem(label='Line 1', renderers=[l1])
li2 = LegendItem(label='Line 2', renderers=[l2])
li3 = LegendItem(label='Line 3', renderers=[l3])
legend_items.append(li1)
legend_items.append(li2)
legend_items.append(li3)

p.y_range.only_visible = True

legend = Legend(items=legend_items, location=(0, -30))
legend.click_policy = "hide"
p.add_layout(legend, 'left')

show(p)
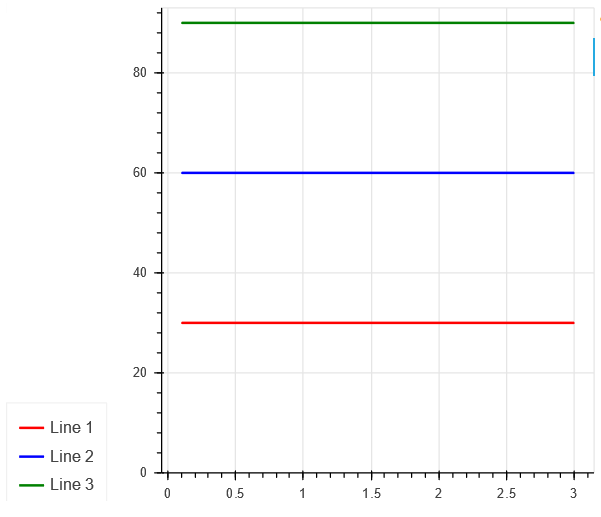
Now we are using automated Y-range scaling. All lines are clearly visible no matter how many lines we have hidden:
or
But if we change Y-values for lines back to 300…
Example 4 (only works in Bokeh 1.4.0):
from bokeh.plotting import figure, output_file, show

x = [0.1, 0.5, 1.0, 1.5, 2.0, 2.5, 3.0]
y1 = [300 for xx in x]
y2 = [600 for xx in x]
y3 = [900 for xx in x]

legend_items = []

# create a new plot with a log axis type
p = figure(plot_width=500, plot_height=400)

l1 = p.line(x, y1, line_width=2, color='red')
l2 = p.line(x, y2, line_width=2, color='blue')
l3 = p.line(x, y3, line_width=2, color='green')

p.y_range.start = 0

li1 = LegendItem(label='Line 1', renderers=[l1])
li2 = LegendItem(label='Line 2', renderers=[l2])
li3 = LegendItem(label='Line 3', renderers=[l3])
legend_items.append(li1)
legend_items.append(li2)
legend_items.append(li3)

p.y_range.only_visible = True

legend = Legend(items=legend_items, location=(0, -30))
legend.click_policy = "hide"
p.add_layout(legend, 'left')

show(p)
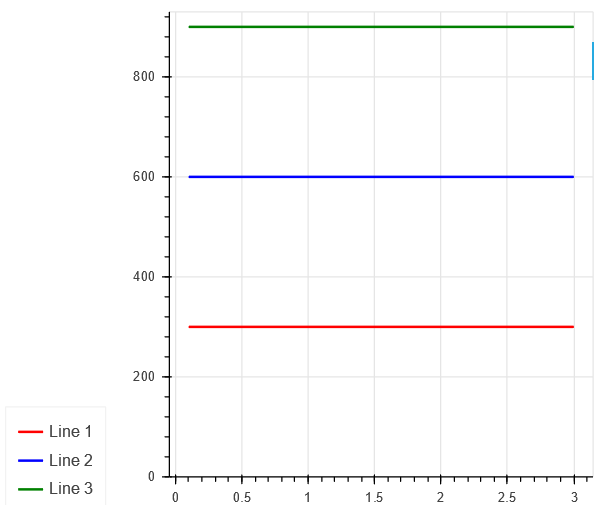
For 3 lines it works fine:
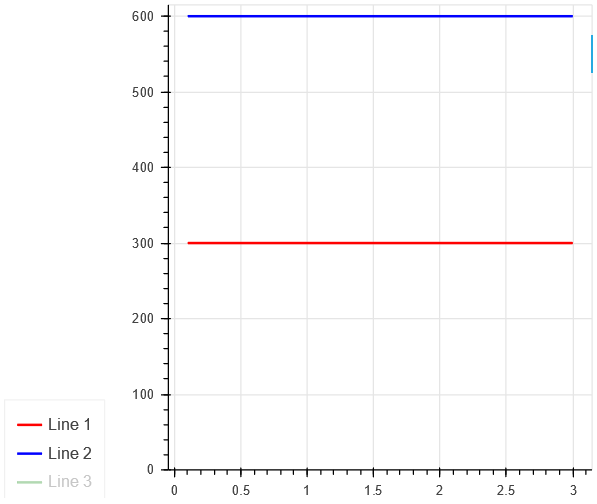
For 2 lines it works fine:
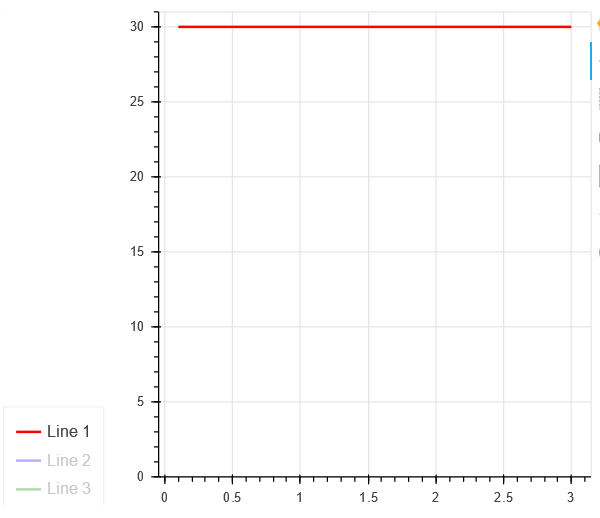
But with only 1 line visible automated padding not working again:
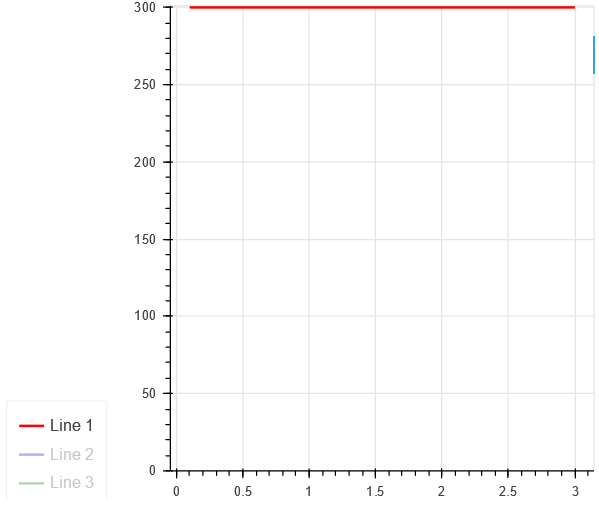
What I would expect?
I would expect to see similar gap between red line and top boundary of the chart, as I see for blue and green lines.
Why it’s important?
Without callbacks there’s no way to change y_range for the chart when certain lines became hidden and visible. As far as I understand, #9144 was supposed to provide simple way to do so, but since automated padding not always working the way you expect it to work, it’s almost useless.
About this issue
- Original URL
- State: closed
- Created 4 years ago
- Comments: 24 (24 by maintainers)
Commits related to this issue
- Add tests for issues #9522, #9703 and #9724 — committed to bokeh/bokeh by mattpap 4 years ago
- Add tests for issues #9522, #9703 and #9724 (#9891) * Add tests for issues #9522, #9703 and #9724 * Reorganize Figure.Attrs under a namespace * Better filtering in devtools' test runner Use ... — committed to bokeh/bokeh by mattpap 4 years ago
@Tikonderoga yes exactly PRs from forks are the standard way to proceed