intellij: CLion Fails to Debug `cc_binary` target on macOS
The Problem
I’ve written a hello world cc_binary target, but my attempts to debug it from within CLion fail.
I’ve created a repository, dwtj/clwb-bugs-example, to demonstrate the problem. It includes analogous CMake and Bazel builds of this program.
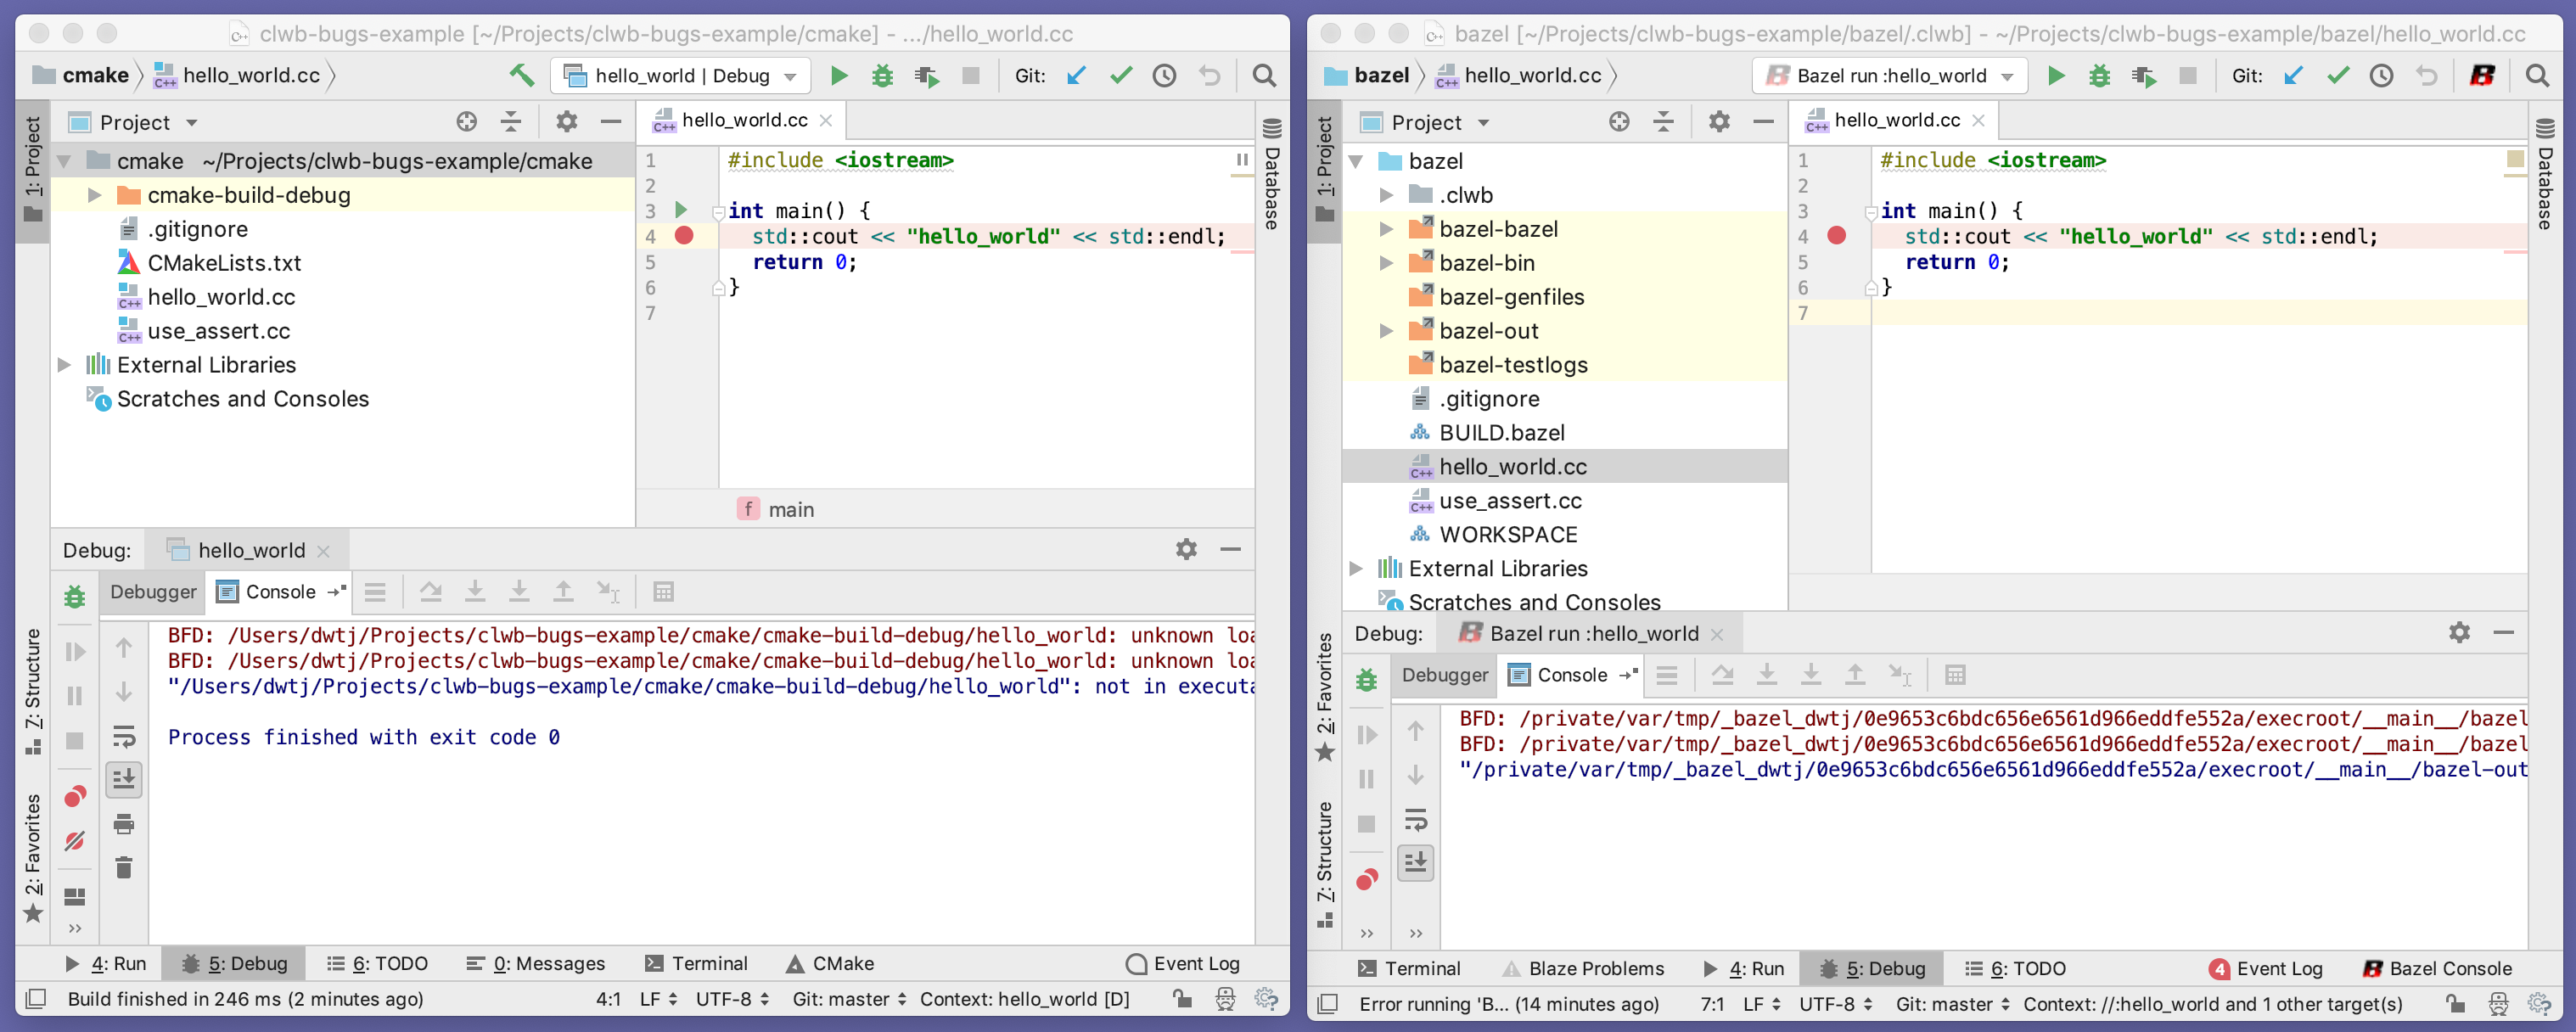
When I use CLion+CMake, I can debug hello_world just fine, but when I try to debug it with CLion+Bazel, I get a red popup error. The image below shows these two projects side-by-side:

The red popup error says:
Error running ‘Bazel run :hello_world’: Debugger executable not specified Configure
Here, “Configure” is a link to CLion’s “Preferences” > “Build, Execution, Deployment” > “Toolchains”. Here’s what that looks like for me:

There are three choices in the “Debugger” drop-down menu:
- Bundled LLDB
- Bundled GDB
- Custom GDB Executable
Note that there doesn’t seem to be a “Custom LLDB” option. For varying reasons, all of these options fail in my CLion+Bazel project.
Bundled LLDB
As described above, “Bundled LLDB” seems to work fine in CLion+CMake, but it fails with the red popup error in CLion+Bazel.
Bundled GDB
When I chose this option, I get “a file format not recognized error.” This happens for both CLion+CMake and CLion+Bazel.
I guess this makes sense, since my Clang/LLVM toolchain is building the program in either case, and evidently GDB won’t work on a Clang-built executable. Here’s the image:

Custom GDB Executable:
I don’t have GCC/GDB installed on my system, so I don’t have a “Custom GDB Executable” to select.
However, if I try to use /usr/bin/lldb as a Custom GDB Executable, I get an error: lldb: unrecognized option '-interpreter=mi2'. As you might expect, this happens for both CLion+CMake and CLion+Bazel. Here’s the image:

My Testing Environment
- macOS 10.14.2 (Mojave)
- CLion v2018.2.7 (Though CLion v2018.3.0+ are more recent, they don’t seem to be compatible with the latest versions of the plugin.)
- Two versions of the plugin,
https://github.com/bazelbuild/intellij:- v2018.12.03.0.2 (latest pre-built release, retrieved within CLion)
0f45ef4(built from source)
- File System: APFS (Case-sensitive, Encrypted)
$ xcodebuild -version
Xcode 10.1
Build version 10B61
$ c++ --version
Apple LLVM version 10.0.0 (clang-1000.11.45.5)
Target: x86_64-apple-darwin18.2.0
Thread model: posix
InstalledDir: /Applications/Xcode.app/Contents/Developer/Toolchains/XcodeDefault.xctoolchain/usr/bin
$ bazel version
WARNING: --batch mode is deprecated. Please instead explicitly shut down your Bazel server using the command "bazel shutdown".
INFO: Invocation ID: d1b8eba4-dc65-4103-9351-c84a51b0c384
Build label: 0.21.0
Build target: bazel-out/darwin-opt/bin/src/main/java/com/google/devtools/build/lib/bazel/BazelServer_deploy.jar
Build time: Wed Dec 19 12:57:09 2018 (1545224229)
Build timestamp: 1545224229
Build timestamp as int: 1545224229
Questions
- Is it possible that my Clang/LLVM/LLDB toolchain just isn’t yet supported by the plugin?
- If that is the case, how can I work around this?
- Do I need to instead use a GCC/GDB toolchain?
- If so, how should I configure my Bazel workspace, a
cc_binarytarget, and acc_librarytarget to use another toolchain? - Is this related to bazelbuild/bazel#6327? When I use CLI
lldbon my hello_world project, I see the same kind of thing in that issue. Might switching to a GCC/GDB toolchain at least let me use CLIgdbon my Bazelcc_binarytargets?
About this issue
- Original URL
- State: closed
- Created 5 years ago
- Reactions: 6
- Comments: 26 (1 by maintainers)
Commits related to this issue
- Run gdbserver script under bash manually. Fixes #494. CLion removes the executable permission on the gdbserver script if the plugin is installed through the marketplace. Don't need to worry about th... — committed to bazelbuild/intellij by deleted user 5 years ago
- Use LLDB driver for if debugger is LLDB. Fixes #494. PiperOrigin-RevId: 251460816 — committed to bazelbuild/intellij by deleted user 5 years ago
- Use LLDB driver for if debugger is LLDB. Fixes #494. PiperOrigin-RevId: 251460816 — committed to bazelbuild/intellij by deleted user 5 years ago
- Use LLDB driver for if debugger is LLDB. Fixes #494. PiperOrigin-RevId: 251515404 — committed to bazelbuild/intellij by deleted user 5 years ago
- Use LLDB driver for if debugger is LLDB. Fixes #494. PiperOrigin-RevId: 251515404 — committed to krlvi/intellij by deleted user 5 years ago
- Use LLDB driver for if debugger is LLDB. Fixes #494. PiperOrigin-RevId: 251515404 — committed to aradchykov/intellij by deleted user 5 years ago
@chaoren Happy to report that it’s working!
Attaching the build from the PR for other to use until it’s released.
clwb_bazel.zip
@dwtj could you debug on macos with clion ?
i built your project < example > successfully and i could run it directly , but i can’t debug it clion just stuck on debug state and disable my breakpoints,
my environment: xcode : 12.0 clion: v2019.3.6 bazel plugin : v2020.07.13 bazel : release 3.5.0
I have a workaround which may be useful for others.
--spawn_strategy=localand rebuilding to ensure that the files necessary for debugging aren’t hidden away in the sandbox..lldbinitto have an entry such assettings set target.source-map . <path_to_repo>. This enables breakpoints to be resolved correctly.TEST_SRCDIRas they aren’t setup due tolldbnot being run under bazel.Please can we reopen this issue? It is definitely still broken. @chaoren
@chaoren This issue is specifically for macOS. I think your solution applies only for Linux. On macOS the folders you are describing do not exist. The corresponding folder on macOS appears to be
$HOME/Library/Application\ Support/CLion2018.3/clwb/gdb/gdbserver. When I add execution permissions to this file there is no change to the debugging error in CLion.