backstage: Kubernetes Plugin 500 errors
Expected Behavior
K8 plugin shouldn’t show 500 errors in logs and UI as our config is correct. Or the error message should go away in the UI once we receive a 200 or not show in the UI at all. We know our config is correct as we can see the pod information in the UI.
Actual Behavior
In the UI we can see the K8 plugin load successfully. After approx 3 mins we start seeing 500 timeout errors. These are being error handled using code & code
We would like to understand why this error handling was put in place and why the 500 errors are returned.
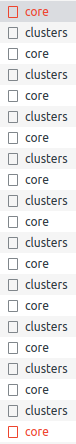
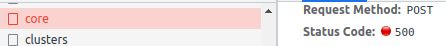
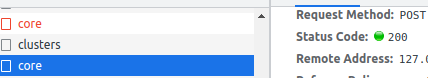
When we use developer tools in the browser (F12) we can see 10 second refresh requests as defined by code. As we can see 200 status codes we know our config is correct and we can successfully see pod data in the UI. However, after 3 mins we get a 500 error in the logs and the UI shows the error. Usually the k8 plugin refresh that is done after 10 seconds is a 200 http code but the error remains in the UI (only the cluster IP updates following the next 500 error). The 500 error happens approx every minute but in the UI the error doesn’t go away until the page is refreshed. Despite the error being there in the UI and the fact we do get 200 status codes too the pod information is still able to update. However, this does not allow a good user experience for our devs. For example, in the screenshots attached you can see we get a 500 and then a 200 status code. We get a few 200 codes until we hit a 500 again. Ideally the UI should remove the error message when the 200 http code has been hit. As the error remains in the UI, we have to refresh the UI for the errors to go away every 3 mins.
Errors in logs:
2022-03-02T09:47:25.428Z kubernetes error action=retrieveObjectsByServiceId service=core, error=Error: connect ETIMEDOUT ourClusterIP:443 type=plugin where core is one of our services.
Following this error we see this in the UI: There was a problem retrieving some Kubernetes resources for the entity: core. This could mean that the Error Reporting card is not completely accurate.
Note. after some time we see the following in the logs 2022-03-02T09:48:00.730Z kubernetes error action=retrieveObjectsByServiceId service=core, error=FetchError: request to https://www.googleapis.com/oauth2/v4/token failed, reason: socket hang up type=plugin although this shouldn’t happen as we are using a Google service account as per google’s docs
From this error in the logs, we get the following message in the UI: Errors: Request failed with 503 , upstream connect error or disconnect/reset before headers. reset reason: connection termination
Again a refresh in the browser fixes this temporarily.
We have also seen the following error in the logs: kubernetes error action=retrieveObjectsByServiceId service=core, error=HttpError: HTTP request failed type=plugin
Steps to Reproduce
We have configured the K8 plugin using docs where we have the below config:
kubernetes:

  serviceLocatorMethod:

    type: 'multiTenant'

  clusterLocatorMethods:

    - type: 'config'

      clusters:

        - url: https://ourClusterIP

          name: dev

          authProvider: 'googleServiceAccount'

          skipTLSVerify: true

          skipMetricsLookup: false

          dashboardApp: gke

          dashboardParameters:

            projectId: ourProjectId

            region: ourZone

            clusterName: ourClusterName

          caData: ${DEV_K8S_CONFIG_CA_DATA}
where we have mounted DEV_K8S_CONFIG_CA_DATA as a K8 secret and have also defined and mounted GOOGLE_APPLICATION_CREDENTIALS which is our gcp’s service account json file. We have 7 clusters (one of which is dev). The other clusters follow a similar config.
Context
We would like a smooth developer user experience i.e the devs shouldn’t need to keep refreshing the UI to remove the error message.
Your Environment
We are hosting backstage in Kubernetes.
Backstage version 0.4.14 Related bug on github
- Browser Information:
Chrome browser
- Output of
yarn backstage-cli info: Run command locally.
yarn run v1.22.17

OS:   Linux 5.13.0-30-generic - linux/x64

node: v14.18.3

yarn: 1.22.17

cli:  0.12.0 (installed)

Dependencies:

  @backstage/app-defaults                                  0.1.5

  @backstage/backend-common                                0.10.4, 0.10.6

  @backstage/backend-tasks                                 0.1.4

  @backstage/catalog-client                                0.5.5

  @backstage/catalog-model                                 0.9.10

  @backstage/cli-common                                    0.1.6

  @backstage/cli                                           0.12.0

  @backstage/config-loader                                 0.9.3

  @backstage/config                                        0.1.13

  @backstage/core-app-api                                  0.5.0

  @backstage/core-components                               0.8.5, 0.8.8, 0.8.7

  @backstage/core-plugin-api                               0.5.0, 0.6.0

  @backstage/errors                                        0.2.0

  @backstage/integration-react                             0.1.19

  @backstage/integration                                   0.7.2

  @backstage/plugin-api-docs                               0.7.0

  @backstage/plugin-app-backend                            0.3.22

  @backstage/plugin-auth-backend                           0.7.0

  @backstage/plugin-catalog-backend                        0.21.0

  @backstage/plugin-catalog-common                         0.1.1

  @backstage/plugin-catalog-import                         0.7.10

  @backstage/plugin-catalog-react                          0.6.12, 0.6.13

  @backstage/plugin-catalog                                0.7.9

  @backstage/plugin-github-actions                         0.4.32

  @backstage/plugin-kubernetes-backend                     0.4.6

  @backstage/plugin-kubernetes-common                      0.2.2

  @backstage/plugin-kubernetes                             0.5.6

  @backstage/plugin-org                                    0.4.0

  @backstage/plugin-pagerduty                              0.3.23

  @backstage/plugin-permission-common                      0.4.0

  @backstage/plugin-permission-node                        0.4.0

  @backstage/plugin-permission-react                       0.3.0

  @backstage/plugin-proxy-backend                          0.2.16

  @backstage/plugin-scaffolder-backend-module-cookiecutter 0.1.9

  @backstage/plugin-scaffolder-backend                     0.15.21

  @backstage/plugin-scaffolder-common                      0.1.3

  @backstage/plugin-scaffolder                             0.12.0

  @backstage/plugin-search-backend-node                    0.4.4

  @backstage/plugin-search-backend                         0.3.1

  @backstage/plugin-search                                 0.5.6

  @backstage/plugin-sonarqube                              0.2.13

  @backstage/plugin-tech-radar                             0.5.3

  @backstage/plugin-techdocs-backend                       0.13.0

  @backstage/plugin-techdocs                               0.13.0

  @backstage/plugin-user-settings                          0.3.17

  @backstage/search-common                                 0.2.1

  @backstage/techdocs-common                               0.11.4

  @backstage/test-utils                                    0.2.3

  @backstage/theme                                         0.2.14

  @backstage/types                                         0.1.1

  @backstage/version-bridge                                0.1.1

Done in 1.03s.
About this issue
- Original URL
- State: closed
- Created 2 years ago
- Comments: 16 (13 by maintainers)
I think this is a bug, we see this sometimes as well and we’re on Azure, not Google. As we have 6 clusters, sometimes we get throttled by Azure and one or more requests may fail, which causes this banner to show and never disappear.
We’re doing a couple of things to mitigate these errors:
objectTypes