druid: KIS tasks in 0.15.1 RC2 sometimes duplicate rows with the same dimension values
Affected Version
0.15.1 RC2
Description
CSV of Results: query-943282d6-3b66-4881-8080-355b09600870.zip
Note that there are 2 rows for timestamp 2019-08-09T02:38:00.000Z, even though the dimensions have the exact same value. In fact, for some reason, the rows are fully duplicated for that time period.
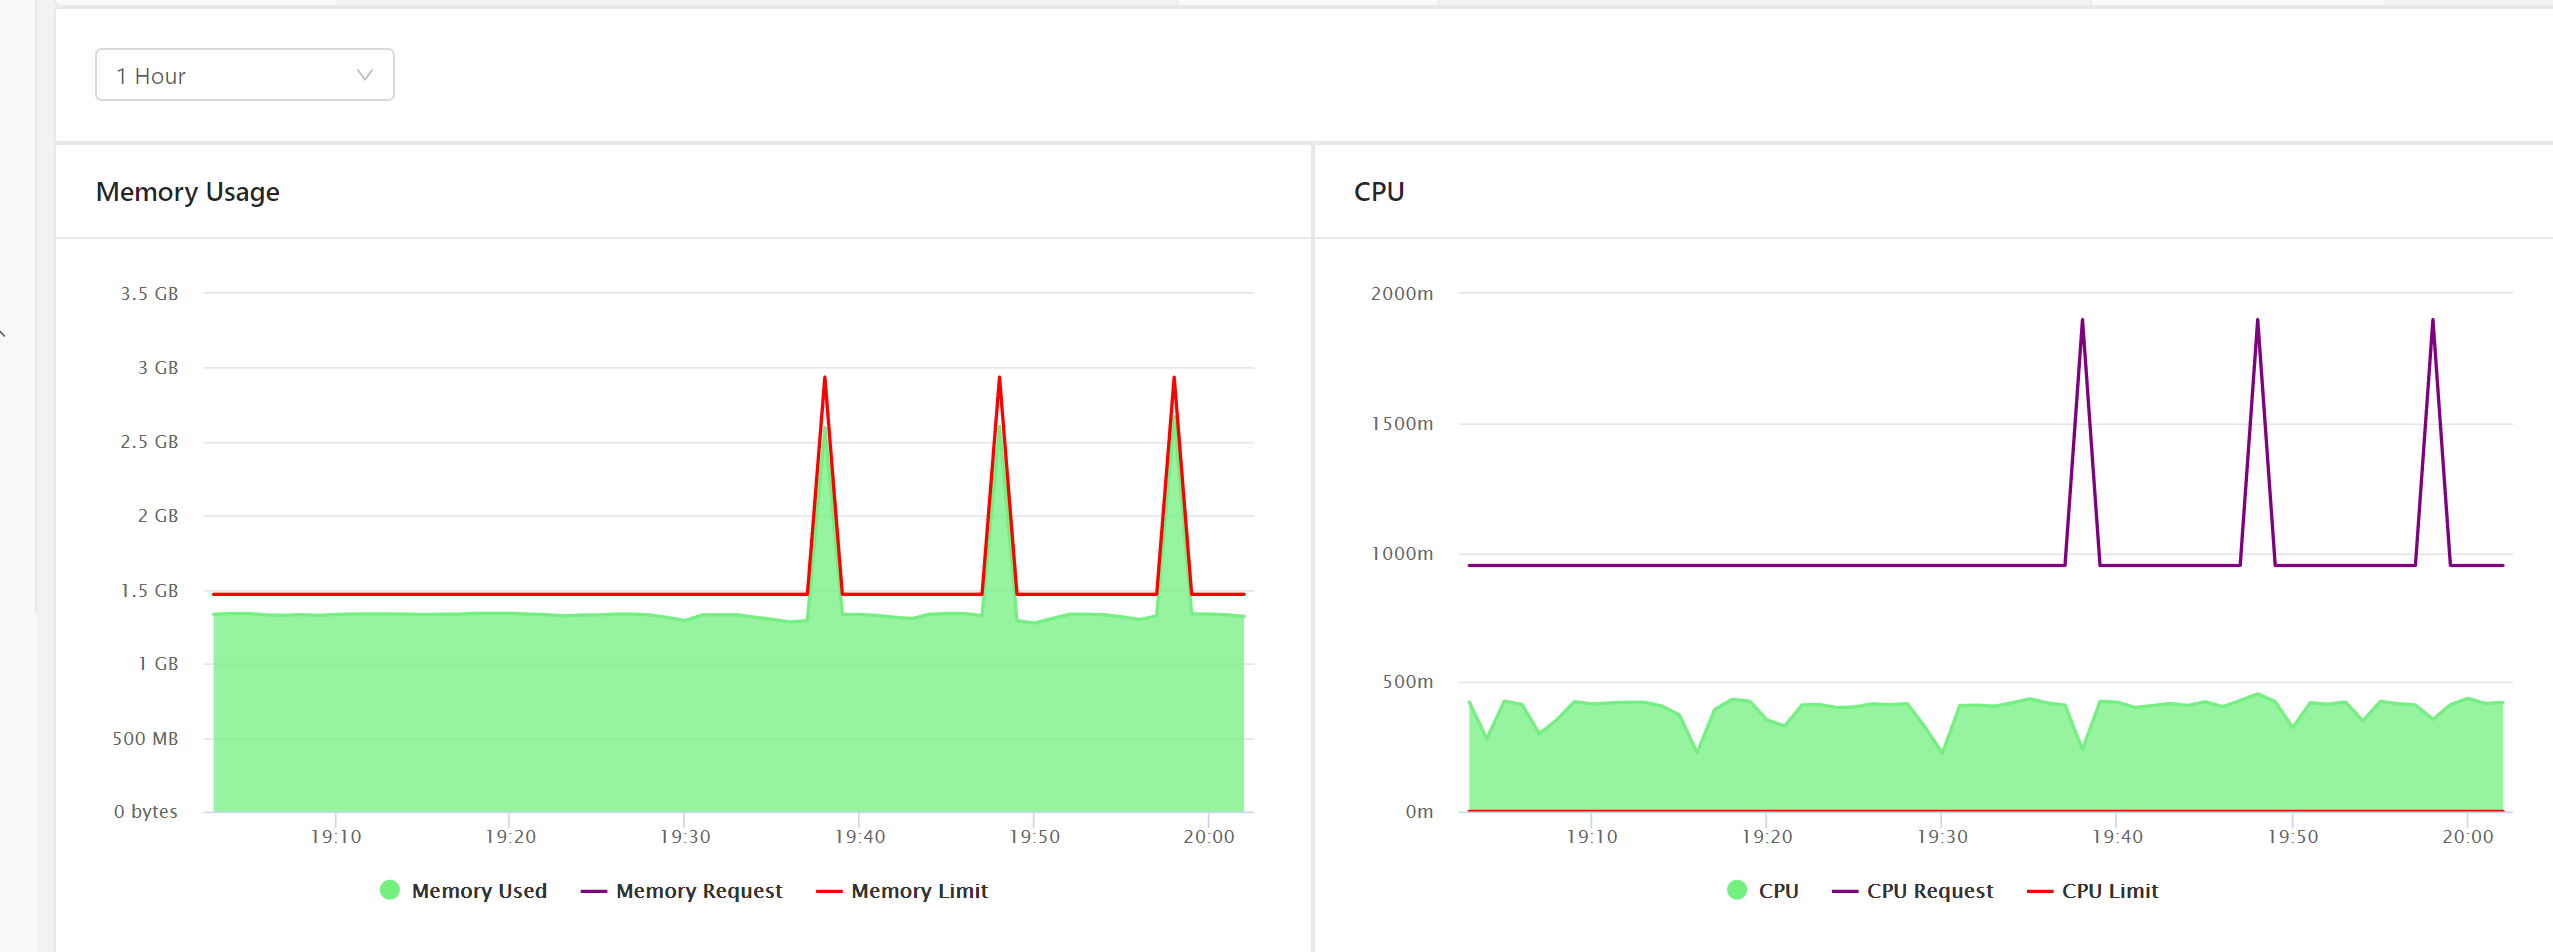
This reflects in charts as values are doubled and it happens pretty often. We noticed it when we saw random spikes in charts when using the aggregated data source. These spikes happen whenever druid duplicates the rows
SQL
SELECT *
 FROM "kube-metrics-minute"
 WHERE accountid='52c7e28eebb26a86fb1505b5' AND
 "__time" >= TIMESTAMP '2019-08-09 02:37:00' AND "__time" < TIMESTAMP '2019-08-09 02:40:00'
 AND cluster='ds' AND etype='container' AND namespace='default' AND name='app-alertproc' AND pod='alertproc-deployment-65f59b6b8-gc57m'
Generated query (shown in router web console)
{
  "queryType": "scan",
  "dataSource": {
    "type": "table",
    "name": "kube-metrics-minute"
  },
  "intervals": {
    "type": "intervals",
    "intervals": [
      "2019-08-09T02:37:00.000Z/2019-08-09T02:40:00.000Z"
    ]
  },
  "virtualColumns": [],
  "resultFormat": "compactedList",
  "batchSize": 20480,
  "limit": 9223372036854776000,
  "order": "none",
  "filter": {
    "type": "and",
    "fields": [
      {
        "type": "selector",
        "dimension": "accountid",
        "value": "52c7e28eebb26a86fb1505b5",
        "extractionFn": null
      },
      {
        "type": "selector",
        "dimension": "cluster",
        "value": "ds",
        "extractionFn": null
      },
      {
        "type": "selector",
        "dimension": "etype",
        "value": "container",
        "extractionFn": null
      },
      {
        "type": "selector",
        "dimension": "namespace",
        "value": "default",
        "extractionFn": null
      },
      {
        "type": "selector",
        "dimension": "name",
        "value": "app-alertproc",
        "extractionFn": null
      },
      {
        "type": "selector",
        "dimension": "pod",
        "value": "alertproc-deployment-65f59b6b8-gc57m",
        "extractionFn": null
      }
    ]
  },
  "columns": [
    "__time",
    "accountid",
    "alloc_cpu",
    "alloc_mem",
    "alloc_pods",
    "cap_cpu",
    "cap_mem",
    "cap_pods",
    "cluster",
    "count",
    "cpu",
    "etype",
    "image",
    "labels",
    "lim_cpu",
    "lim_mem",
    "mem_limit",
    "mem_used",
    "name",
    "namespace",
    "node",
    "node_pool",
    "owner",
    "owner_kind",
    "pod",
    "req_cpu",
    "req_mem",
    "rxBytes",
    "txBytes"
  ],
  "legacy": false,
  "context": {
    "sqlQueryId": "f39f0b78-bb97-4c81-b9dd-7e0e2abf0b46"
  },
  "descending": false,
  "granularity": {
    "type": "all"
  }
}
Supervisor task spec:
{
  "type": "kafka",
  "dataSchema": {
    "dataSource": "kube-metrics-minute",
    "parser": {
      "type": "string",
      "parseSpec": {
        "format": "json",
        "timestampSpec": {
          "column": "timestamp",
          "format": "auto"
        },
        "dimensionsSpec": {
          "dimensions": [
            "accountid",
            "cluster",
            "name",
            "namespace",
            "etype",
            "labels",
            "owner",
            "owner_kind",
            "node",
            "image",
            "pod",
            "node_pool"
          ]
        }
      }
    },
    "metricsSpec": [
      {
        "name": "count",
        "type": "count"
      },
      {
        "name": "req_cpu",
        "fieldName": "req_cpu",
        "type": "floatMax"
      },
      {
        "name": "req_mem",
        "fieldName": "req_mem",
        "type": "longMax"
      },
      {
        "name": "lim_cpu",
        "fieldName": "lim_cpu",
        "type": "floatMax"
      },
      {
        "name": "lim_mem",
        "fieldName": "lim_mem",
        "type": "longMax"
      },
      {
        "name": "cap_cpu",
        "fieldName": "cap_cpu",
        "type": "floatMax"
      },
      {
        "name": "cap_mem",
        "fieldName": "cap_mem",
        "type": "longMax"
      },
      {
        "name": "cap_pods",
        "fieldName": "cap_pods",
        "type": "floatMax"
      },
      {
        "name": "alloc_cpu",
        "fieldName": "alloc_cpu",
        "type": "floatMax"
      },
      {
        "name": "alloc_mem",
        "fieldName": "alloc_mem",
        "type": "longMax"
      },
      {
        "name": "alloc_pods",
        "fieldName": "alloc_pods",
        "type": "floatMax"
      },
      {
        "name": "cpu",
        "fieldName": "cpu",
        "type": "doubleMax"
      },
      {
        "name": "rxBytes",
        "fieldName": "rxBytes",
        "type": "longMax"
      },
      {
        "name": "txBytes",
        "fieldName": "txBytes",
        "type": "longMax"
      },
      {
        "name": "mem_used",
        "fieldName": "mem_used",
        "type": "longMax"
      },
      {
        "name": "mem_limit",
        "fieldName": "mem_limit",
        "type": "longMax"
      }
    ],
    "granularitySpec": {
      "type": "uniform",
      "segmentGranularity": {"type": "period", "period": "PT4H"},
      "queryGranularity": "MINUTE"
    }
  },
  "tuningConfig": {
    "type": "kafka",
    "maxRowsPerSegment": 5000000
  },
  "ioConfig": {
    "topic": "kube-metrics",
    "consumerProperties": {
      "bootstrap.servers": "xx"
    },
    "taskCount": 1,
    "replicas": 2,
    "taskDuration": "PT4H"
  }
}
About this issue
- Original URL
- State: closed
- Created 5 years ago
- Comments: 22 (21 by maintainers)
With Kafka ingestion, it’s possible that rollup is not 100%, due to the incremental publishing, e.g.:
{"timestamp":"2019-08-09 14:00:00", "dim1":"hello", "metric":1}{"timestamp":"2019-08-09 14:00:00", "dim1":"hello", "metric":2}arrives, it won’t be rolled up into the first already published segment, and a non-aggregating query would return both of those rowsIf you run an exact aggregating query like:
does the sum on CPU return the expected value?
You could compare the results of that query across the minute/second/30m datasources and see if they match, to rule out imperfect rollup from incremental publishes.