angular-cli: Sourcemaps generated by all versions >= 1.7.0-beta.2 do not work in the VS Code Chrome/Firefox Debuggers
Versions
Angular CLI: 1.7.1
Node: 9.5.0
OS: win32 x64
Angular: 5.2.6
... animations, common, compiler, compiler-cli, core, forms
... http, language-service, platform-browser
... platform-browser-dynamic, router

@angular/cli: 1.7.1
@angular-devkit/build-optimizer: 0.3.2
@angular-devkit/core: 0.3.2
@angular-devkit/schematics: 0.3.2
@ngtools/json-schema: 1.2.0
@ngtools/webpack: 1.10.1
@schematics/angular: 0.3.2
@schematics/package-update: 0.3.2
typescript: 2.5.3
webpack: 3.11.0
Other: Yarn 1.3.2 Win 10 Professional x64 Chrome x64 64.0.3282.167 VS Code 1.20.1 x64 VS Code - Debugger for Chrome 4.1.0 VS Code - Debugger for Firefox 1.1.0
Repro steps
- ng new
- Add some test code:
import { Component } from '@angular/core';

@Component({
  selector: 'app-root',
  template: `
    <button (click)="onClicked()">TEST</button>
  `,
  styleUrls: ['./app.component.css']
})
export class AppComponent {
  title = 'app';

  onClicked() {
    console.log('test');
  }
}
- ng serve
- Start debugging using this config:
{
   "name": "Launch Chrome against localhost, with sourcemaps",
   "type": "chrome",
   "request": "launch",
   "url": "http://localhost:4200/",
   "runtimeArgs": [
     "--user-data-dir",
     "--remote-debugging-port=9222"
   ],
   "sourceMaps": true,
   "webRoot": "${workspaceRoot}"
 }
- Set a breakpoint on the button click handler
- Click button
Observed behavior
Nothing happens. After refreshing the page in chrome, breakpoints sometimes get hit, but VS Code shows them on the wrong line. Using the Firefox debugger yields the same results.
Desired behavior
The breakpoint gets hit in VS Code.
Mention any other details that might be useful (optional)
Recent versions <= 1.7.0-beta.1 work as expected All versions >= 1.7.0-beta.2 do not work (latest checked: v6.0.0-beta.5 / v1.7.3)
We use the same tools on all of our development machines. The observed behavior is the same on every one.
Breakpoints work as expected when set in the webpack sources using chrome dev tools.
Removing the runtimeArgs or webRoot entries from the launch config doesn’t help.
Someone posted a similar issue on the VSCode Chrome Debugger repo here.
Workaround
Using
debugger;
works, see this comment.
About this issue
- Original URL
- State: closed
- Created 6 years ago
- Reactions: 22
- Comments: 39 (2 by maintainers)
@satlom I was able to get debugging working by adding the following source map path override to my configuration in
.vscode/launch.json:You can clone https://github.com/mjolka/angular-cli-issue-9729 and then
Ctrl + Shift + Bsrc/app/app.component.ts:9F5This is still a issue!
This is not working! Breakpoint changes to the top of the file.
While the fix @mjolka describes works for the basic functionality of hitting the breakpoint initially, there are still some pretty substantial issues.
I’m not sure to what extent some of this is VS Code’s fault and what of it is Angular’s fault, but given that it seemed to start in with 1.7, I’m thinking there’s more coming from Angular than from VS Code.
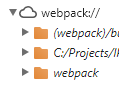
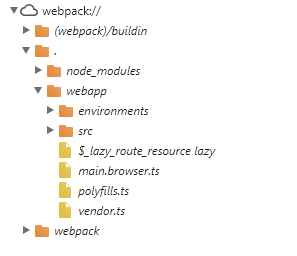
So before 1.7.0-beta.1 , generated sourcemap has full path as root directory
After 1.7.0, generated sourcemap now returns root directory as .
This can be found by accessing Sources tab from Chrome Developer Tools.
VS Code: Typescript 2.6.2 1.7.0, 1.7.1, 1.7.2 doesn’t work 1.6.8 does.
I have been following this thread since it was also broken on my side and I thought that the latest change from @blopez2010 was working since I was able to hit breakpoints but then I realized that it was hitting indeed but I couldn’t get the variables values, so I was just about to revert to
1.6.8yet again……but wait, I found the best solution which is a lot simpler than all other provided in this thread, and it works (hopefully for everyone this time) 😃
You really need 2 changes from the original code
webRootto"webRoot": "${workspaceFolder}/src"(or your source folder containing the files)sourceMapPathOverrideswith 1 line in it.Here’s my final result
in my case, I don’t have
/srcbut another folder name and so mywebRoot(if my folder is named “mySource”) is actually something alongSo just use
srcor the name of your folder containing, well your source files. You may also want to add theuserDataDirbut that is totally optional, if so use something along this"userDataDir": "${workspaceFolder}/.chrome",And voilà! I finally have breakpoints working and ready for Angular 6.x 😃
How did I get the map path override? Simple, start the debugger in VSCode and in the “Debug Console” terminal window, type
.scriptsand see what path you need for updating thesourceMapPathOverridesI have this issue too and what I did to fix it is:
npm install -g @angular/cli@1.6.8ng serveso it will take the global installed version instead of the one used by the project.I really hope someone fix this issue soon.
Some logging I took.
Using angular/cli latest version:
webpack:/src/store/treatment-groups-store.ts (/Users/user/Documents/projects/projectname/src/store/webpack:/src/store/treatment-groups-store.ts)Using angular/cli@1.6.8
webpack:/src/store/treatment-groups-store.ts (../../src/store/treatment-groups-store.ts)Please note the differences between paths, this was taken running
.scriptsin vscode DEBUG CONSOLEI have applied many of the comments listed below with no luck.
UPDATE
After some more research this should work with latest cli versions (mine is
1.7.2):Same here, sourcemaps are broken in current versions. Fix: If you use
in your typescript code instead if setting a breakpoint, it works, even with sourcemaps and all.
This is the configuration that works for me:
@blopez2010 it’s working very well, thank you.
Angular CLI: 1.7.4 Node: 8.11.1 OS: win32 x64 Angular: 5.2.9
Great find mjolka! I have tried this settings, and it worked with the latest Angular-CLI 1.7.3 and VS Code 1.21.0. Big thank!!